¶ Overview
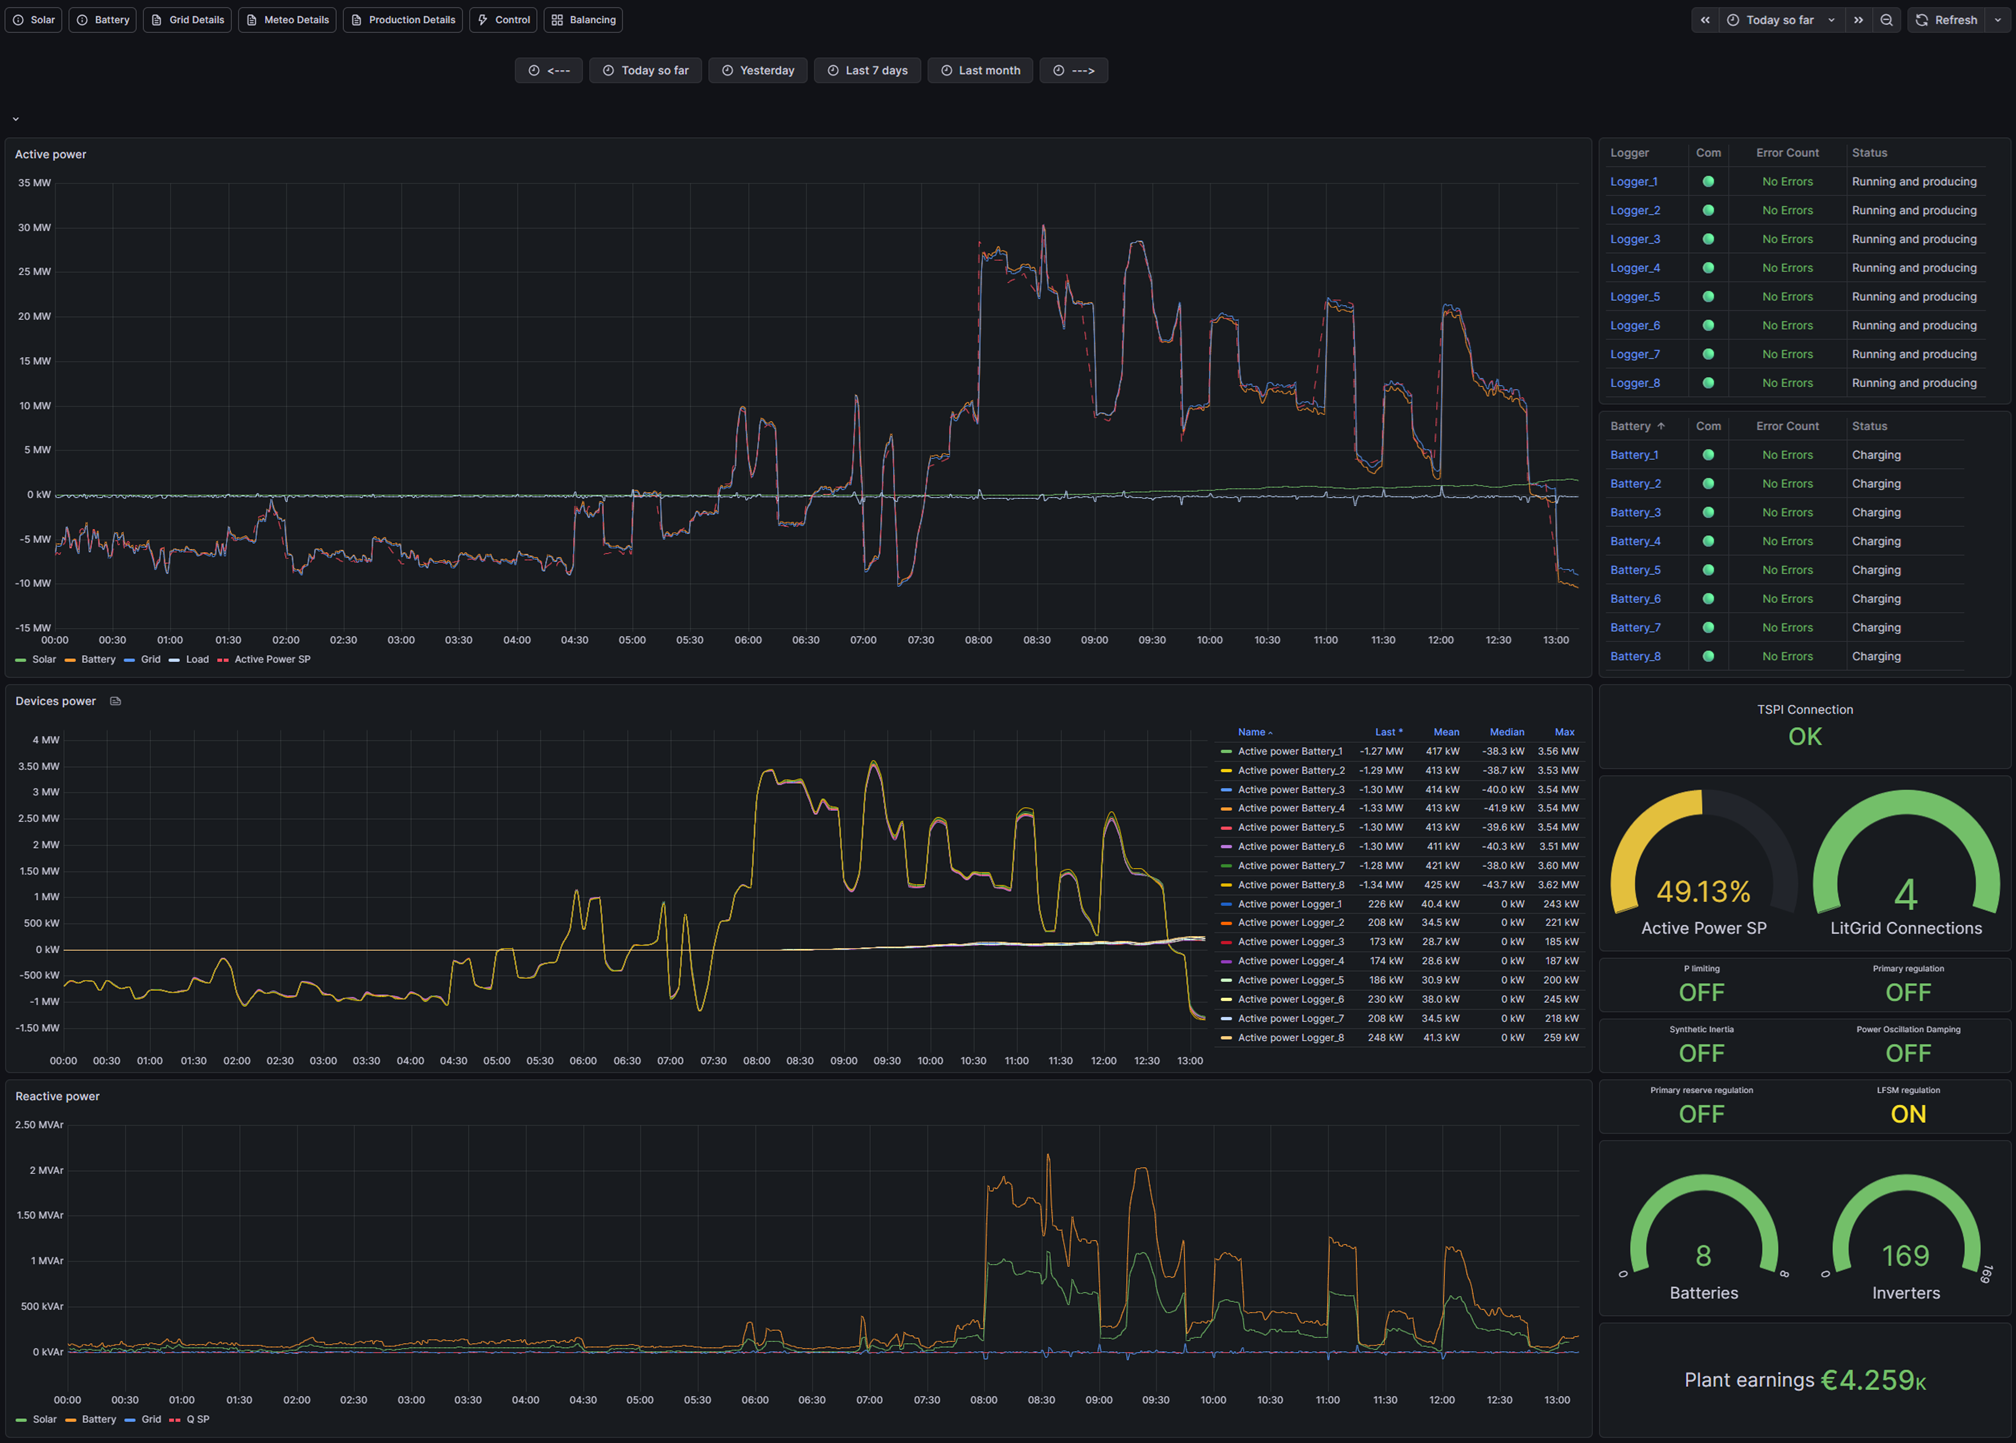
This page provides a general overview of the plant operating in hybrid mode (here combining Solar and Battery), operation into a single, plant-level view. It is intended for understanding overall behavior, limits, and control response at the Point of Interconnection (POI).
Use the time picker at the top (e.g. Today so far, Yesterday, Last 7 days) to select the analysis window. Data does not auto-refresh; click Refresh after changing the range.
¶ What this page shows
- Plant Active Power time series, combining Solar and Battery contributions and compared against the Active Power Setpoint.
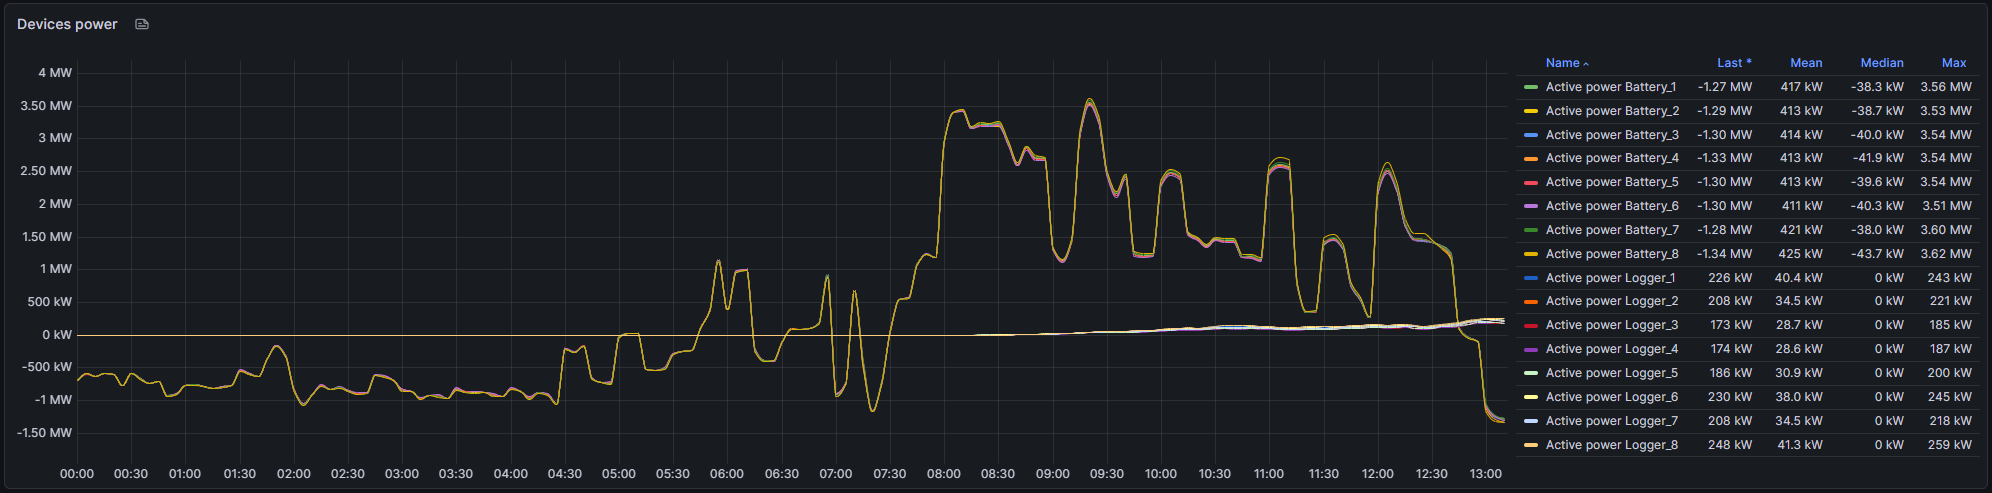
- Device-level contribution summaries to identify uneven participation or limiting behavior.
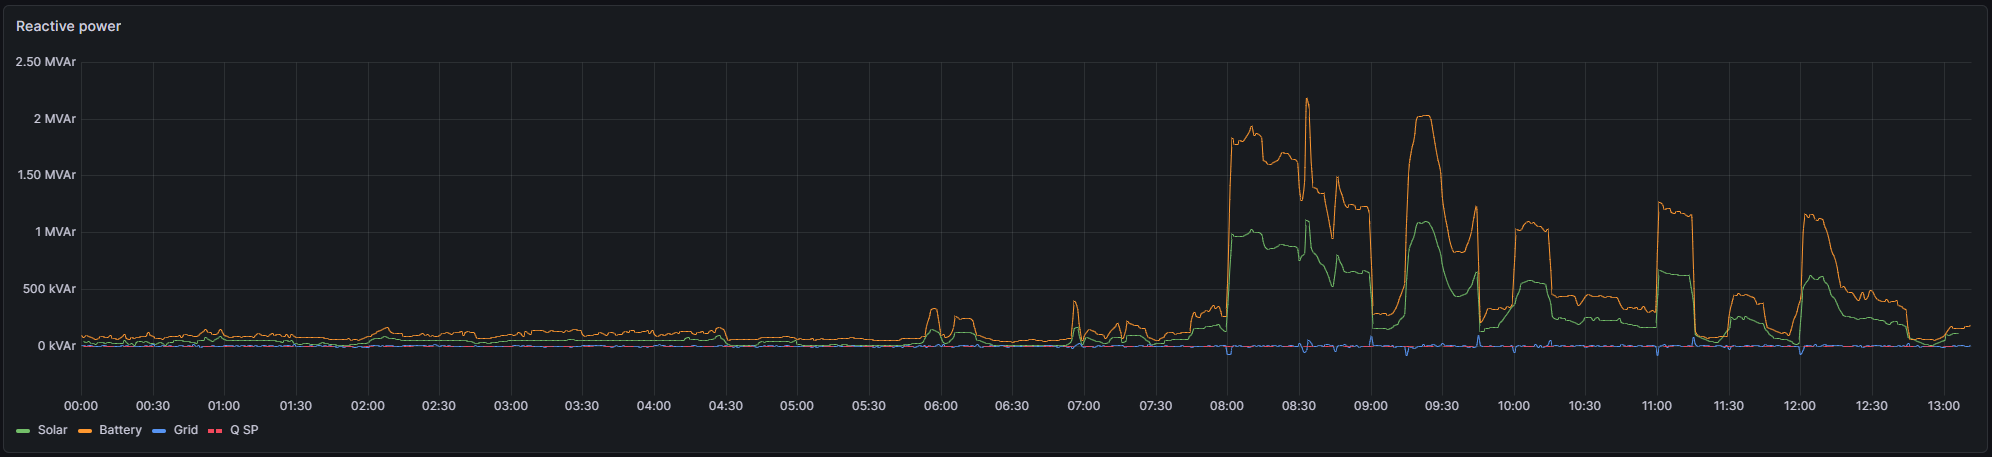
- Reactive Power (Q) behavior at the POI and its relationship to reactive control modes and setpoints.
- Status and control indicators in the right-hand strip, providing quick operational context.
Note: Irradiance, PV-only axes, and battery-specific telemetry are intentionally omitted here and must be consulted on their respective pages.
¶ Main panels
¶ Active Power (Plant)
Displays the total plant active power at the POI, including both Solar and Battery contributions, compared with the Active Power Setpoint (dashed line). This panel is the primary reference for assessing curtailment, dispatch tracking, and hybrid coordination.
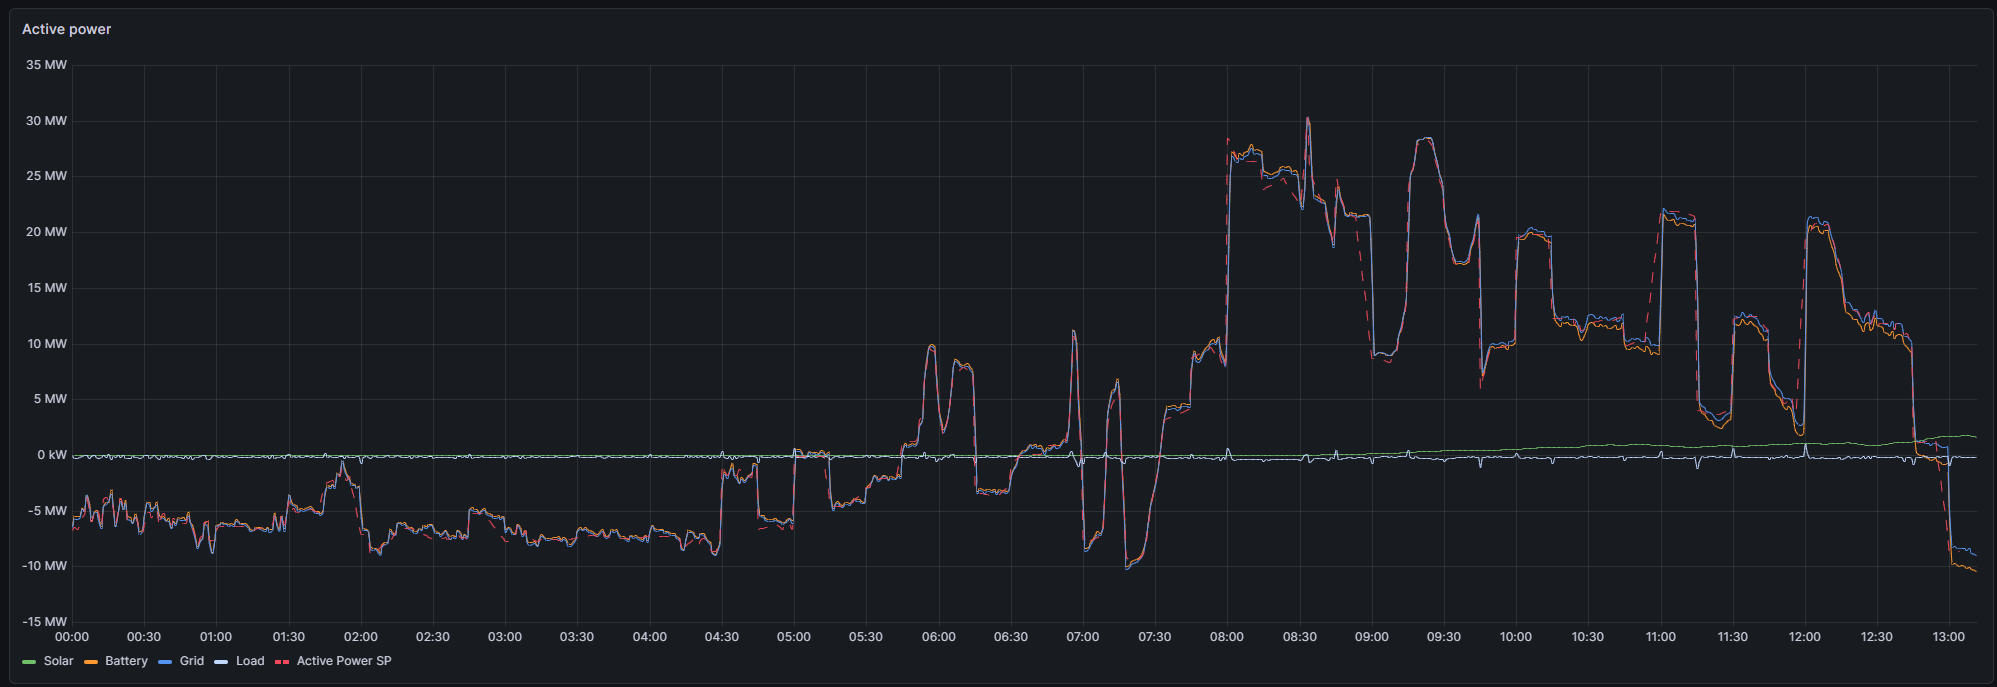
Note: The Load measurement is calculated as the sum of all generation sources (Battery + Solar + Wind) minus the Active Power at the POI. This value represents the current grid load seen by the plant.
¶ Devices Power
Shows aggregated power contributions from individual devices. The accompanying table summarizes Last, Mean, and other statistics, enabling quick identification of devices that are offline, limited, or not participating as expected.Per-MT or per-Logger active power traces provide a deeper look into how different blocks of the plant respond during ramps, curtailment events, and dispatch changes.
¶ Reactive Power (Q)
Displays reactive power (Q) at the POI. Compare the measured response with the configured Reactive Mode and Q or Voltage setpoints shown in the right-side status strip. Persistent offsets may indicate tuning or headroom limitations.
¶ Right-side strip
The right-side strip provides operational context for the selected time range, including communication health, control modes, and regulation flags. These indicators help interpret the behavior seen in the time-series panels.
- Connection status for TSPI, TSO, and field devices.
- Active Power Setpoint shown as a percentage of nominal power.
- Regulation flags such as P limiting, primary regulation, POD, and synthetic inertia.
- Fleet summary including number of batteries, inverters, and basic earnings.
Note: All values respect the selected time range and update only after clicking Refresh.