¶ Overview
The Meteo Details page displays all key environmental parameters measured by the plant’s PPC system. These include irradiance, module temperature, ambient temperature, and wind speed. Use this data to correlate weather conditions with generation and equipment performance, validate model inputs, and diagnose potential production losses due to soiling, shading, or cooling effects.
¶ Measurement Type Selection
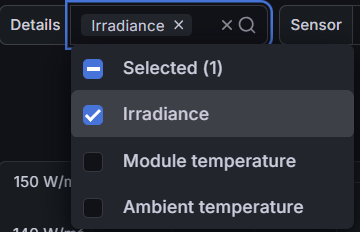
Use the Source selector to choose which meteorological parameter you want to display on the chart. You can select any combination of the available measured parameters:
- Irradiance — Plane-of-array solar irradiance (W/m²), the key input for the plant’s performance model.
- Module temperature — Measured at the back of PV modules, used to estimate temperature-related performance losses.
- Ambient temperature — Outdoor air temperature near the modules, useful for detecting cooling effects and environmental impact.
- Wind speed — Wind velocity (m/s) measured at the site meteorological mast, affects module cooling and safety operations.
¶ Sensor Selection
The Sensor menu allows you to pick which sensors to include in the chart. You can select all plant sensors or compare individual ones to identify discrepancies between different locations.
- Plant — Aggregated average of all installed sensors for a given measurement type.
- Sensor 1 / 2 / 3 — Individual sensors installed at different zones or mounting structures.
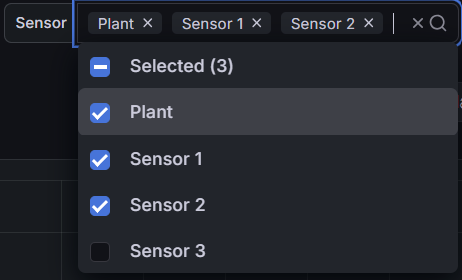
Tip: Comparing Plant average vs. individual sensors helps identify shading, sensor drift, or localized anomalies.
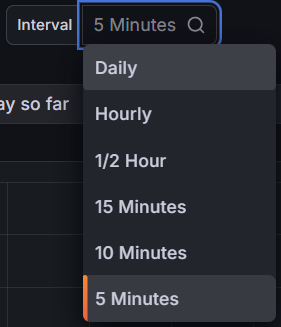
¶ Interval (Granularity)
The Interval control defines the time granularity for data aggregation. Choose shorter intervals (e.g., 5 or 10 minutes) for detailed diagnostics, or longer ones (hourly/daily) for trend visualization.
¶ Meteo Chart & Legend
The graph displays the selected parameter(s) for the chosen sensors and interval. Use it to analyze correlations and check the stability or accuracy of meteorological inputs.
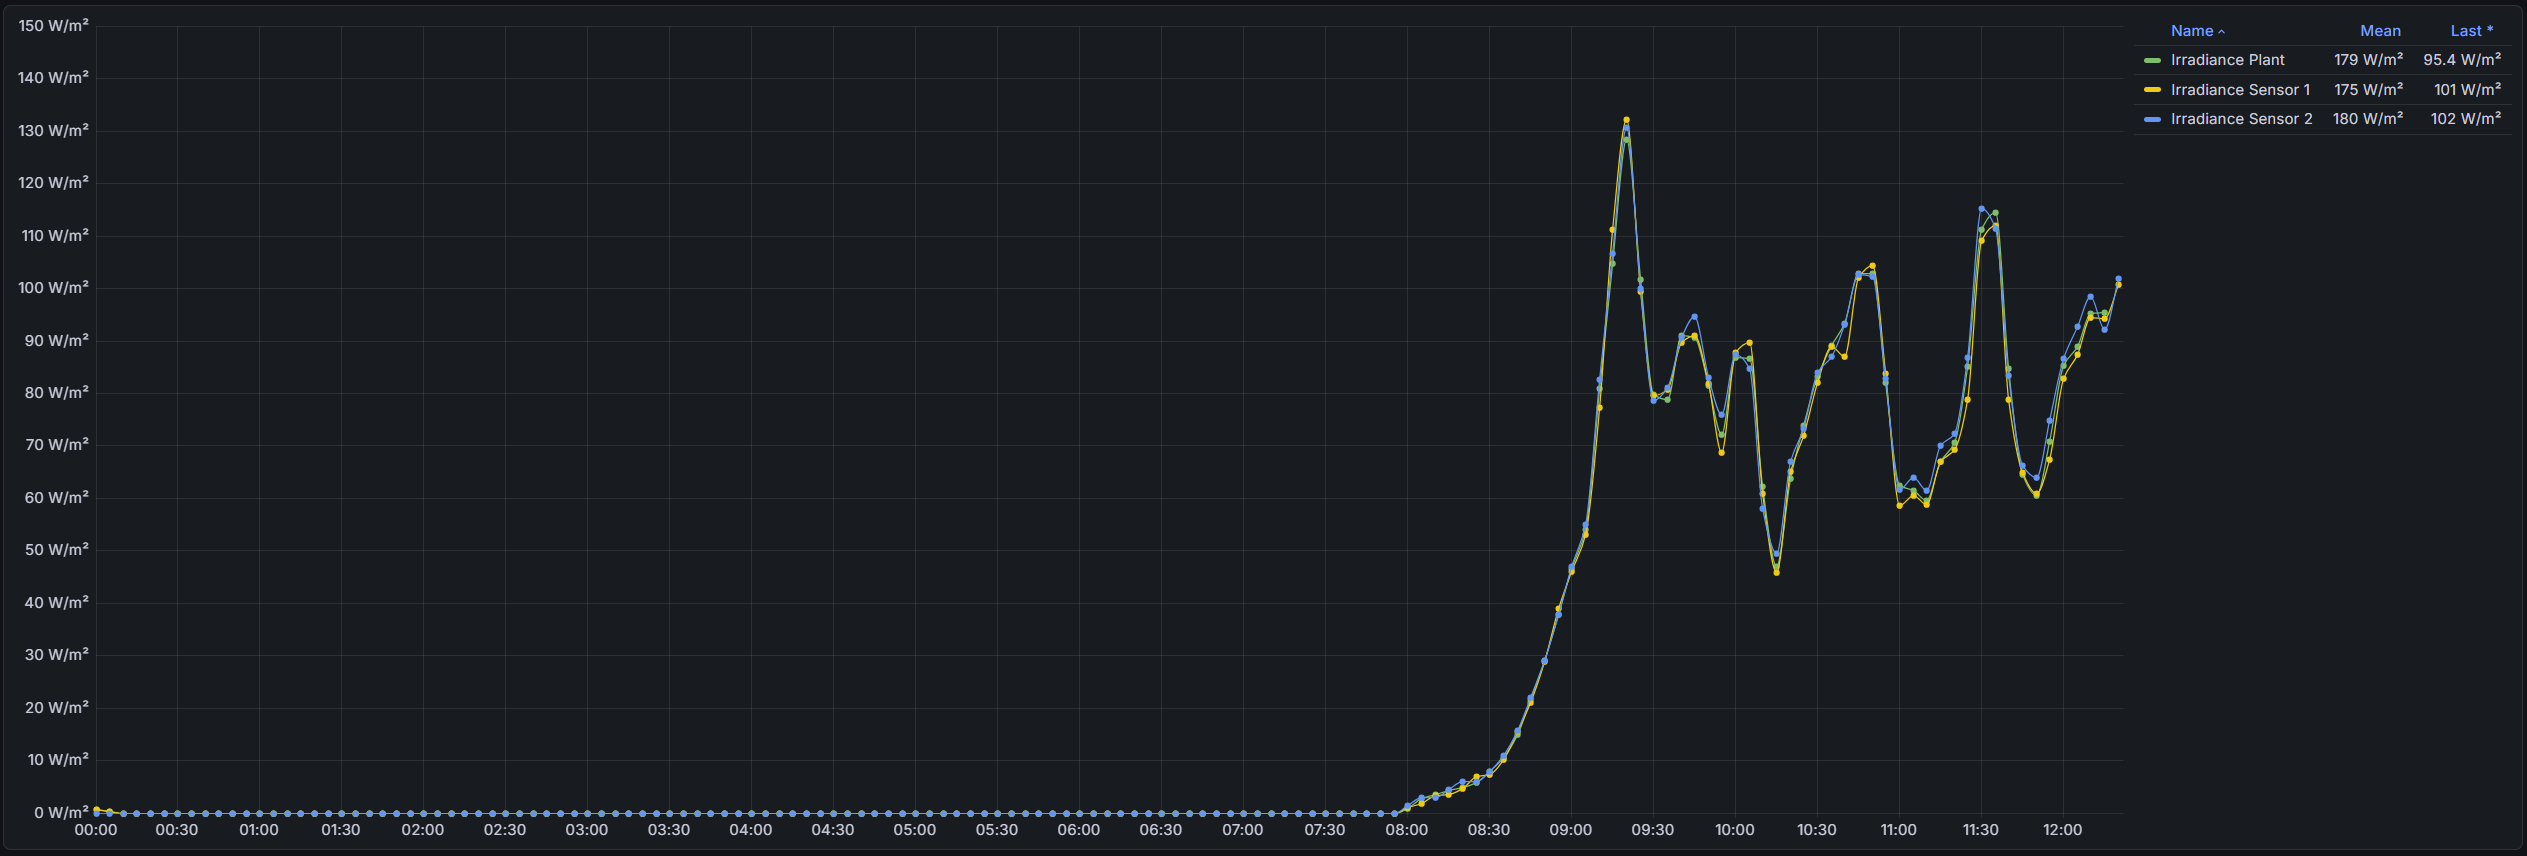
- Mean: Average value across the selected interval.
- Last: Most recent sensor reading.
- Legend: Identifies each curve and displays its associated statistics.
Reminder: This chart provides real-time insight into environmental conditions affecting production. Data quality depends on accurate sensor calibration and correct aggregation interval.