¶ Overview
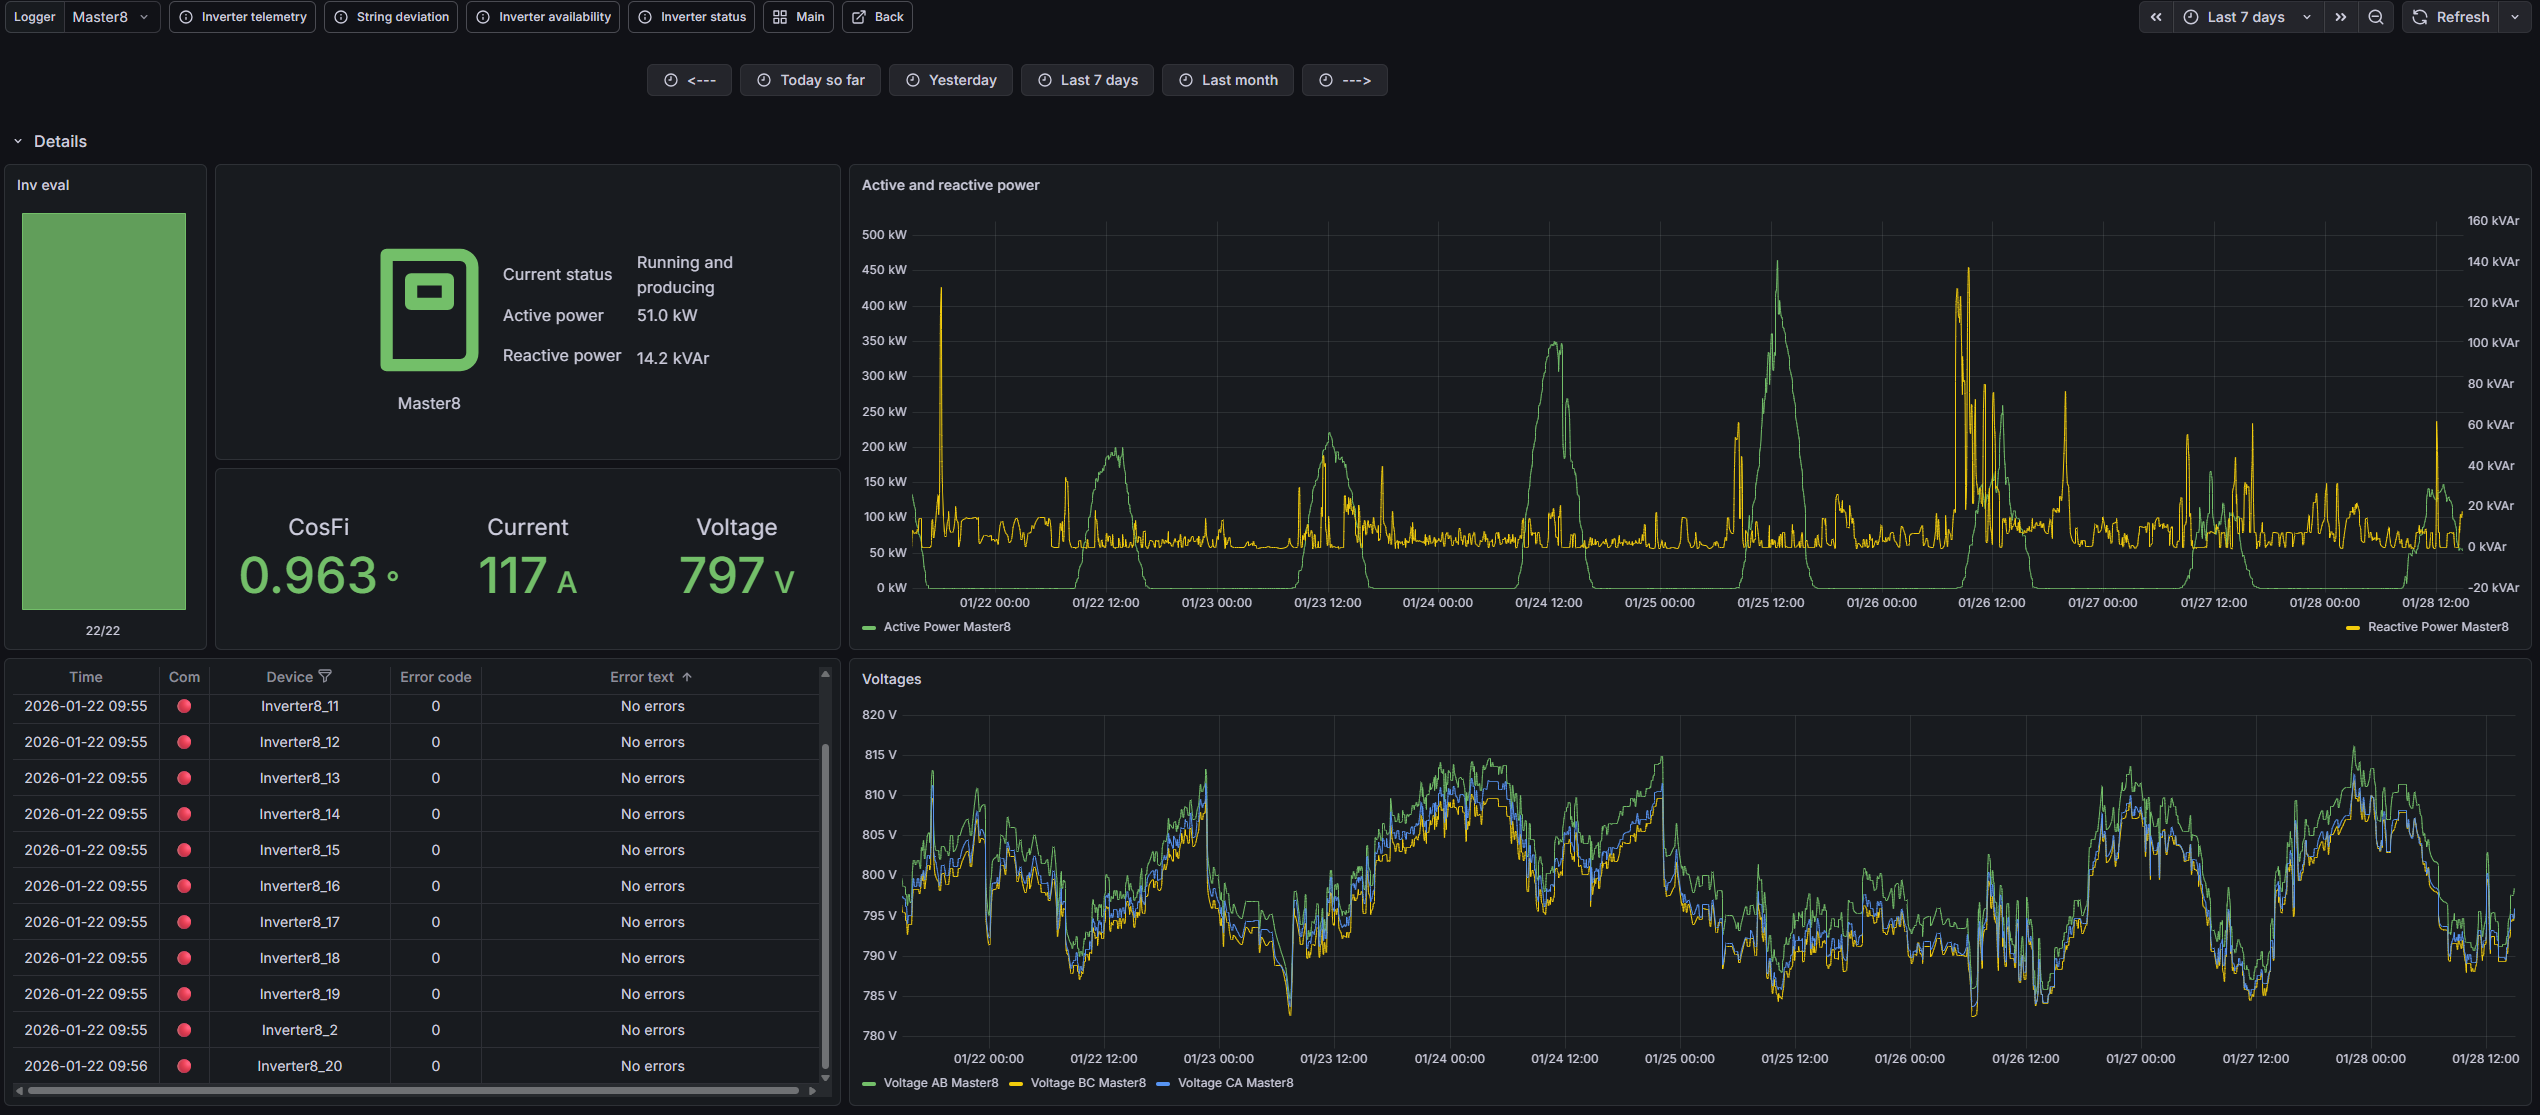
The Generation Source Details page is a dedicated view for inspecting generation source devices (for example, a Solar logger, a Battery controller, or a Wind device) at the highest operational level. It combines time-series telemetry (such as active/reactive power) with a status-at-a-glance panel and an error list so you can quickly understand how the selected device is behaving during the chosen time range.
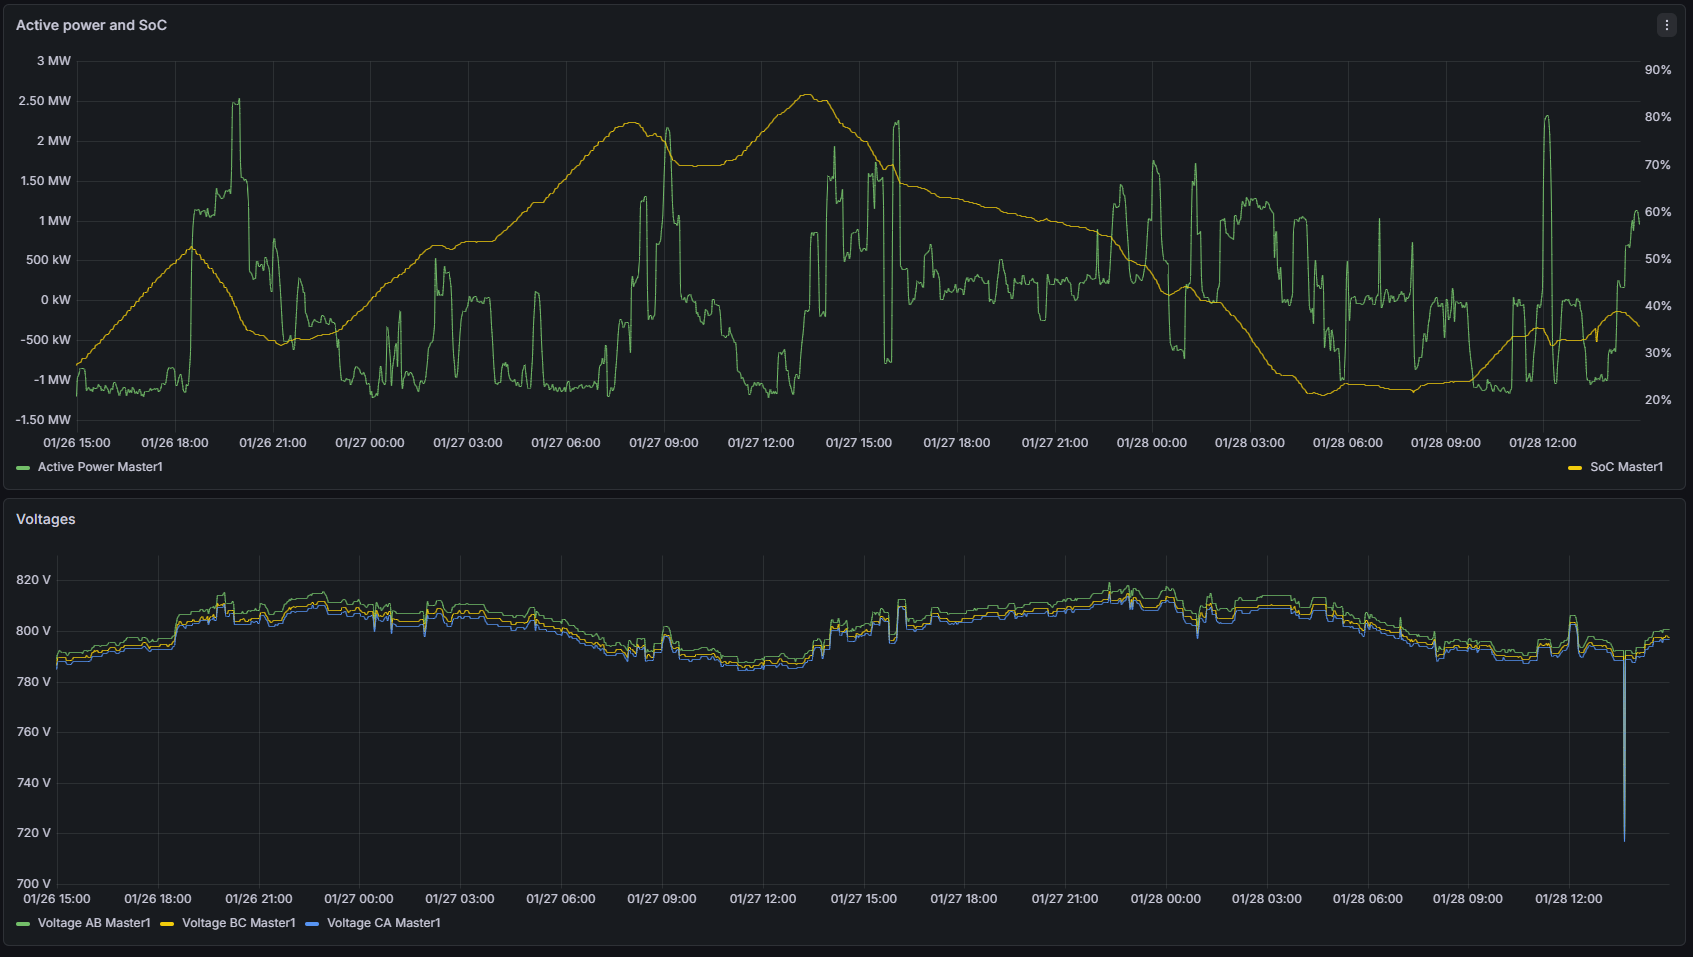
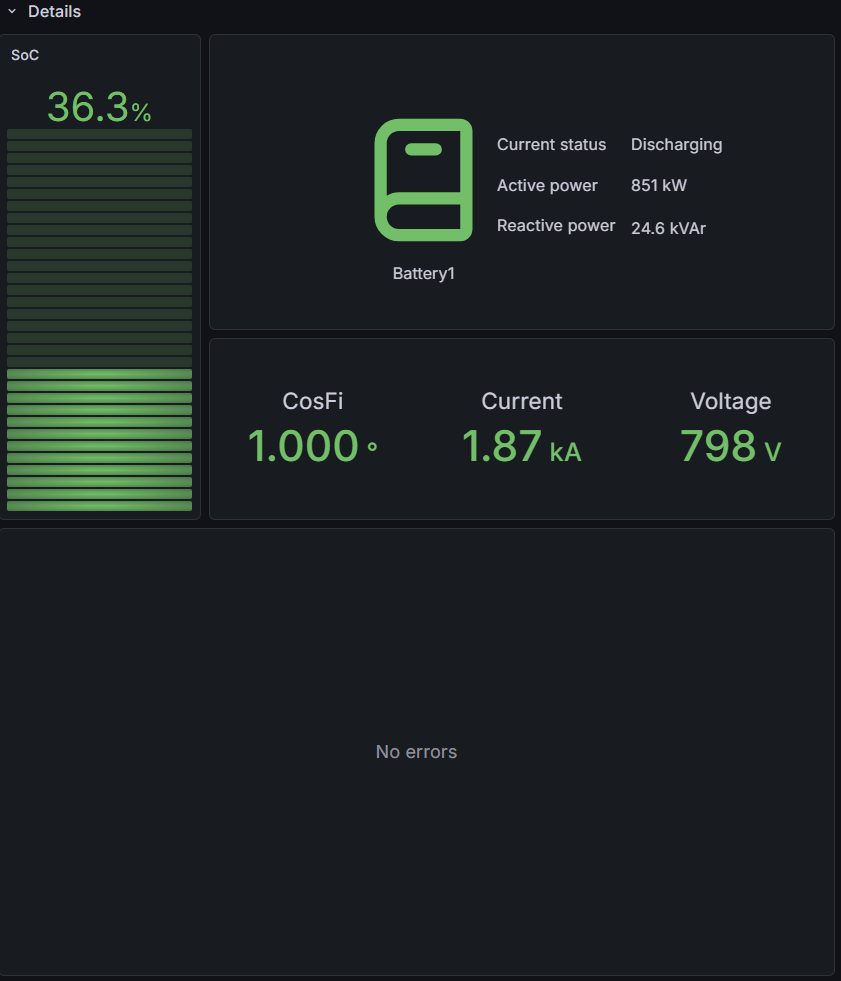
The page adapts to the selected source type: for example, Battery devices include SoC context, while Solar devices expose solar-specific pages (deviation/availability) in related navigation.
¶ Telemetry & device status
¶ Time-series graphs
The main graphs show time-series telemetry for the selected device. Typical panels include: Active and Reactive Power, and electrical context such as Voltages. For Battery devices, the main graph may also include SoC (State of Charge) so power behavior can be interpreted against available energy.
The Device selector is located at the top-right of the page. Use it to choose which device you want to inspect. Once selected, the charts, status cards, and error list update to show telemetry for that highlighted device.
¶ Status-at-a-glance & errors
The status panel alongside the graphs summarizes the device’s connection state, current operational status, and latest measured values (e.g., active/reactive power, voltage, current, SoC for batteries). If the device reports issues, the error list provides detailed rows describing active errors and their timestamps.
¶ Related pages
From this device view you can jump to other source pages for the same generation type:

- 🗎 Telemetry →
- 🗎 Deviation → (Solar only)
- 🗎 Availability → (Solar only)
- 🗎 Status →