¶ Overview
The String Deviation view shows, for one or multiple inverters at a time, how each connected string deviates from that inverter’s median string current over the chosen time range. Negative bars highlight underperformance; positive bars indicate strings performing above the inverter median. This assessment is strictly based on measured string current (A).
Use this tool to rapidly narrow down why production is lacking in a specific area of the park—for example dirty modules, shading, blown fuses, wiring issues, or mismatch—before deep-diving with other diagnostics.
¶ Timeframe & Scope
Pick a time window using the Grafana time-picker (e.g., Today so far / Yesterday / custom). Deviation is computed over the selected period, so results reflect conditions in that window. Keep scope focused: this page analyzes selected inverters at a time to ensure a clear ranking of their strings relative to each inverter’s median.
¶ Select Inverter
The workflow mirrors the Inverter Details page →. Select one or multiple inverters for comparison.
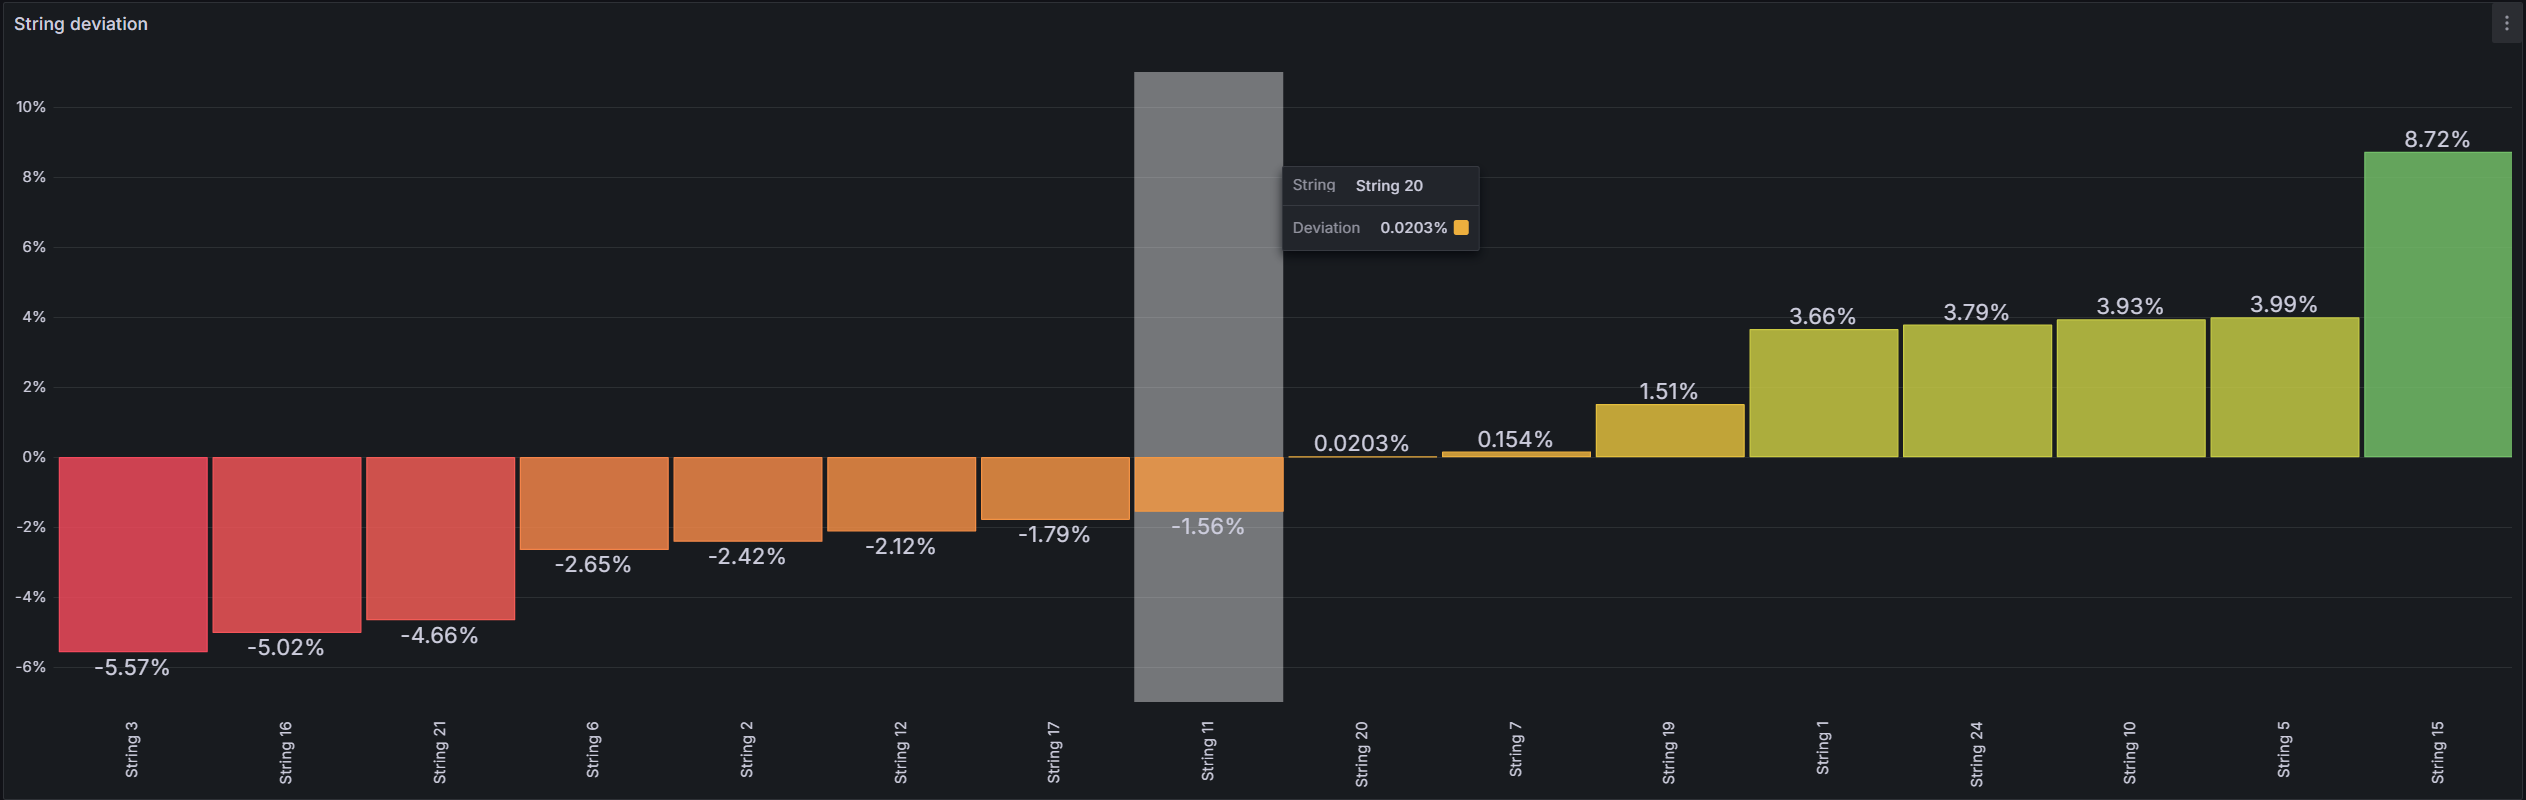
¶ Deviation Graph
This visualization makes it easy to identify the worst-performing strings at a glance, guiding targeted inspections in the field.
- Orange / Red bars → strings performing below the mean (underperformance).
- Green bars → strings performing above the mean.