¶ Overview
The PR page displays the Performance Ratio of the entire plant as percentage bars over time. You can view this ratio either by day or by month, depending on the selected aggregation period. The PR metric helps evaluate how effectively the plant converts available solar energy into usable AC electricity relative to its installed DC capacity.
Note: PR is a normalized efficiency metric that eliminates the influence of weather, making it ideal for comparing performance over time or between plants.
¶ Controls — Period Selection
The Period control allows switching between Daily and Monthly aggregation. After changing the period, click Refresh to update the graph.

- Daily: Each bar represents a single day within the selected time frame.
- Monthly: Each bar represents one calendar month within the selected range.
¶ Reading the PR Chart
The PR graph shows percentage values calculated for each selected period. Bars allow visual comparison of performance across days or months.
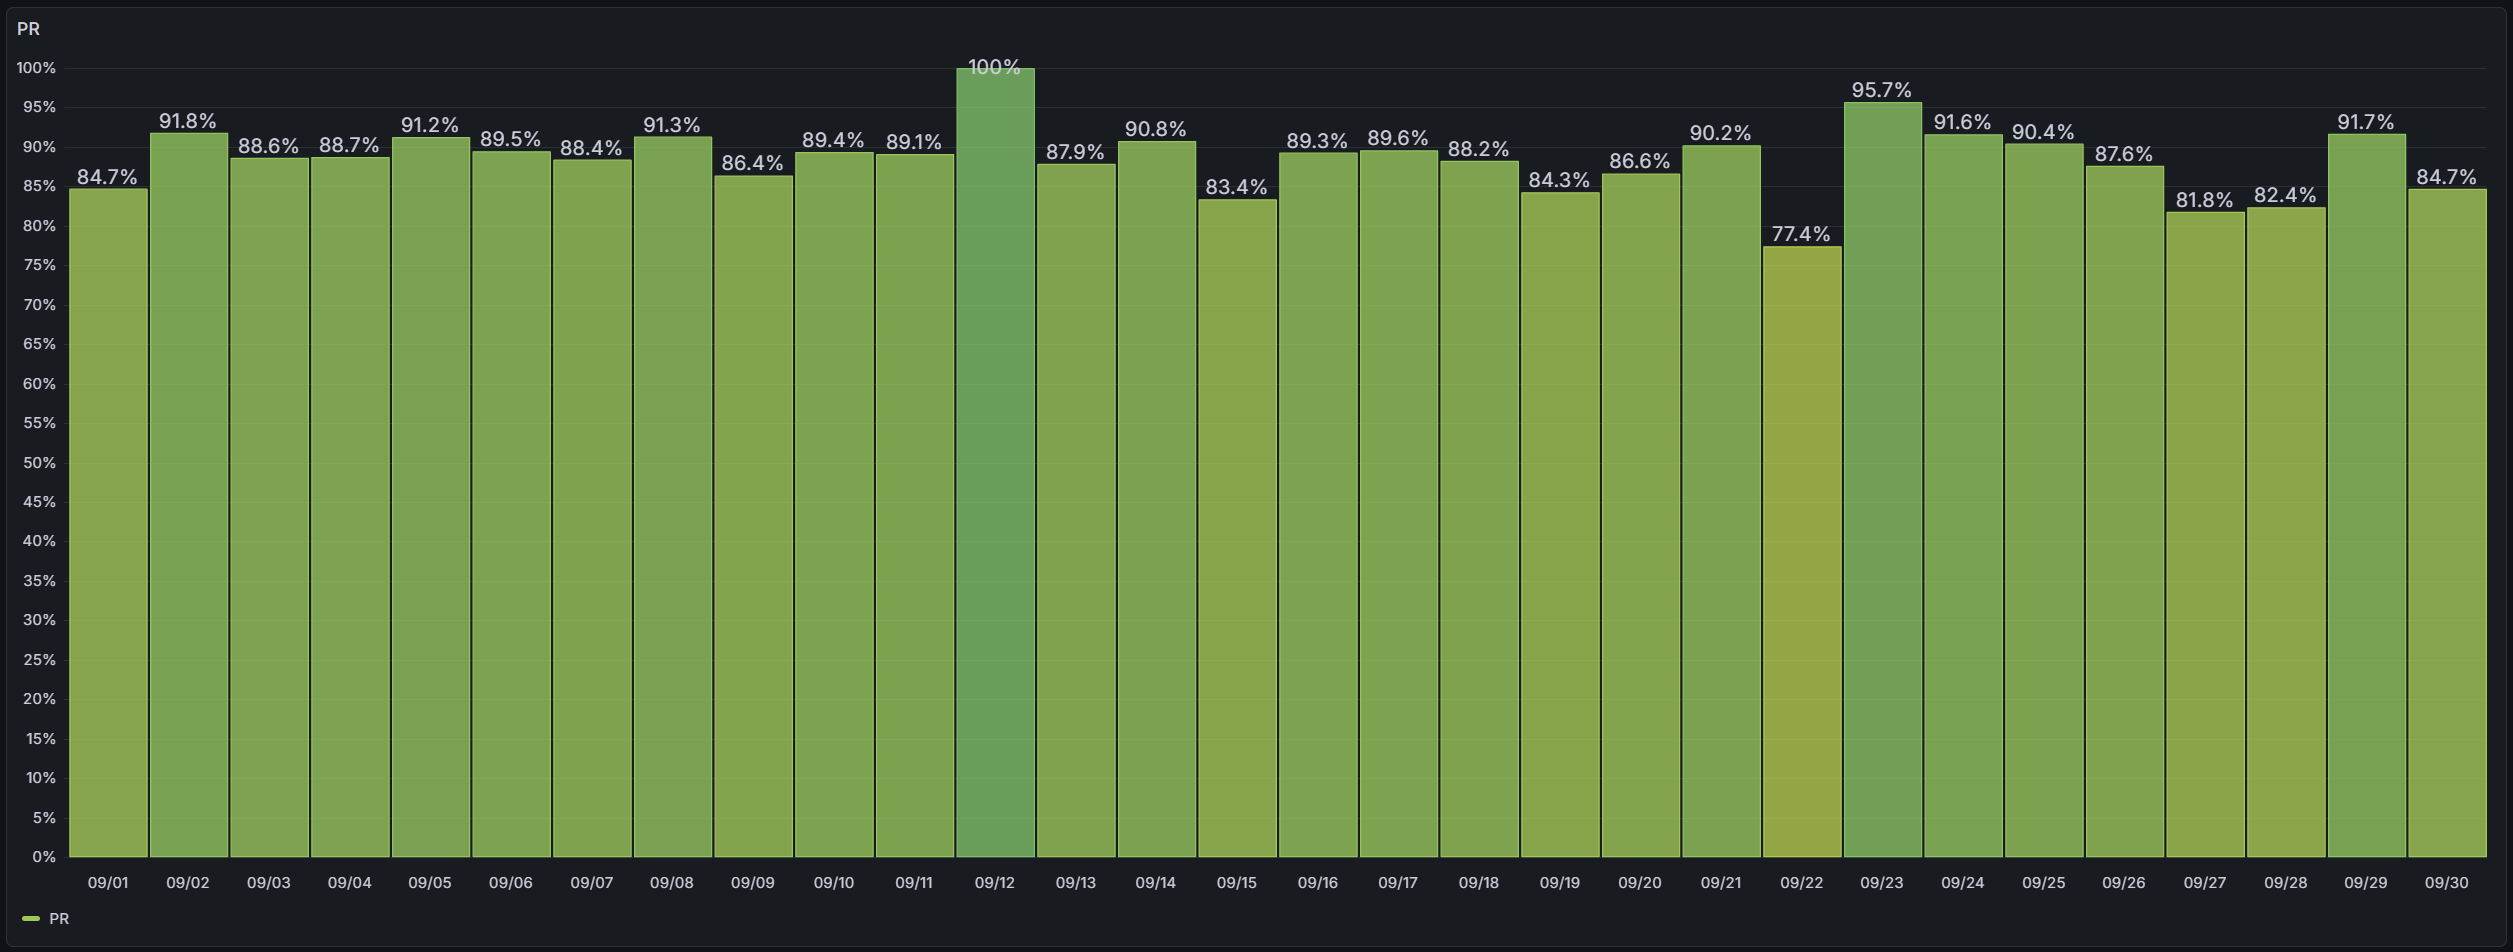
- Bars: Each bar represents the calculated PR% for that period.
- Labels: Display exact values above each bar.
- Interpretation: Values near 100% indicate high performance; lower values suggest energy losses or operational issues.
The resulting value is expressed as a percentage (%), representing how efficiently the plant converts available solar energy into usable output. A PR close to 100% indicates ideal conversion efficiency under given conditions.
PR = EAC / ( GPOA × Pinstalled )
Formula in accordance with the IEC 61724-1 standard.
- EAC: Measured AC energy production (kWh) — total electrical energy exported to the grid.
- GPOA: Integrated plane-of-array irradiance (kWh/m²) — total received solar energy on the module surface during the selected period.
- Pinstalled: Installed DC power (kW) — total nominal capacity of the photovoltaic array.