¶ Overview
The Estimated Losses view quantifies potentially lost energy by comparing the actual measured production to an estimated production baseline that assumes no curtailment or limiting. Unlike older delta views, this page does not separate losses by curtailment source. Instead, it provides a single aggregated estimate of lost energy for each time bucket.
Definition: Estimated losses represent the difference between what the plant could have produced under unconstrained conditions and what was actually produced, based on available telemetry and models.
¶ Time & Period Selection
The calculation window and aggregation are controlled using:
- Grafana time-picker — defines the overall analysis window.
- TSPI navigation arrows — step forward/backward in time or jump to presets (Today, Yesterday).
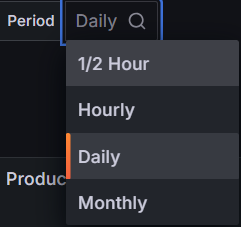
- Period selector — sets aggregation granularity (10 Minutes, 15 Minutes, ½ Hour, Hourly, Daily, Monthly).
¶ Estimated Losses Chart
The bar chart visualizes actual production alongside estimated losses for each aggregation period. Losses are shown as a single value per time bucket and represent the total unrealized energy during that interval.
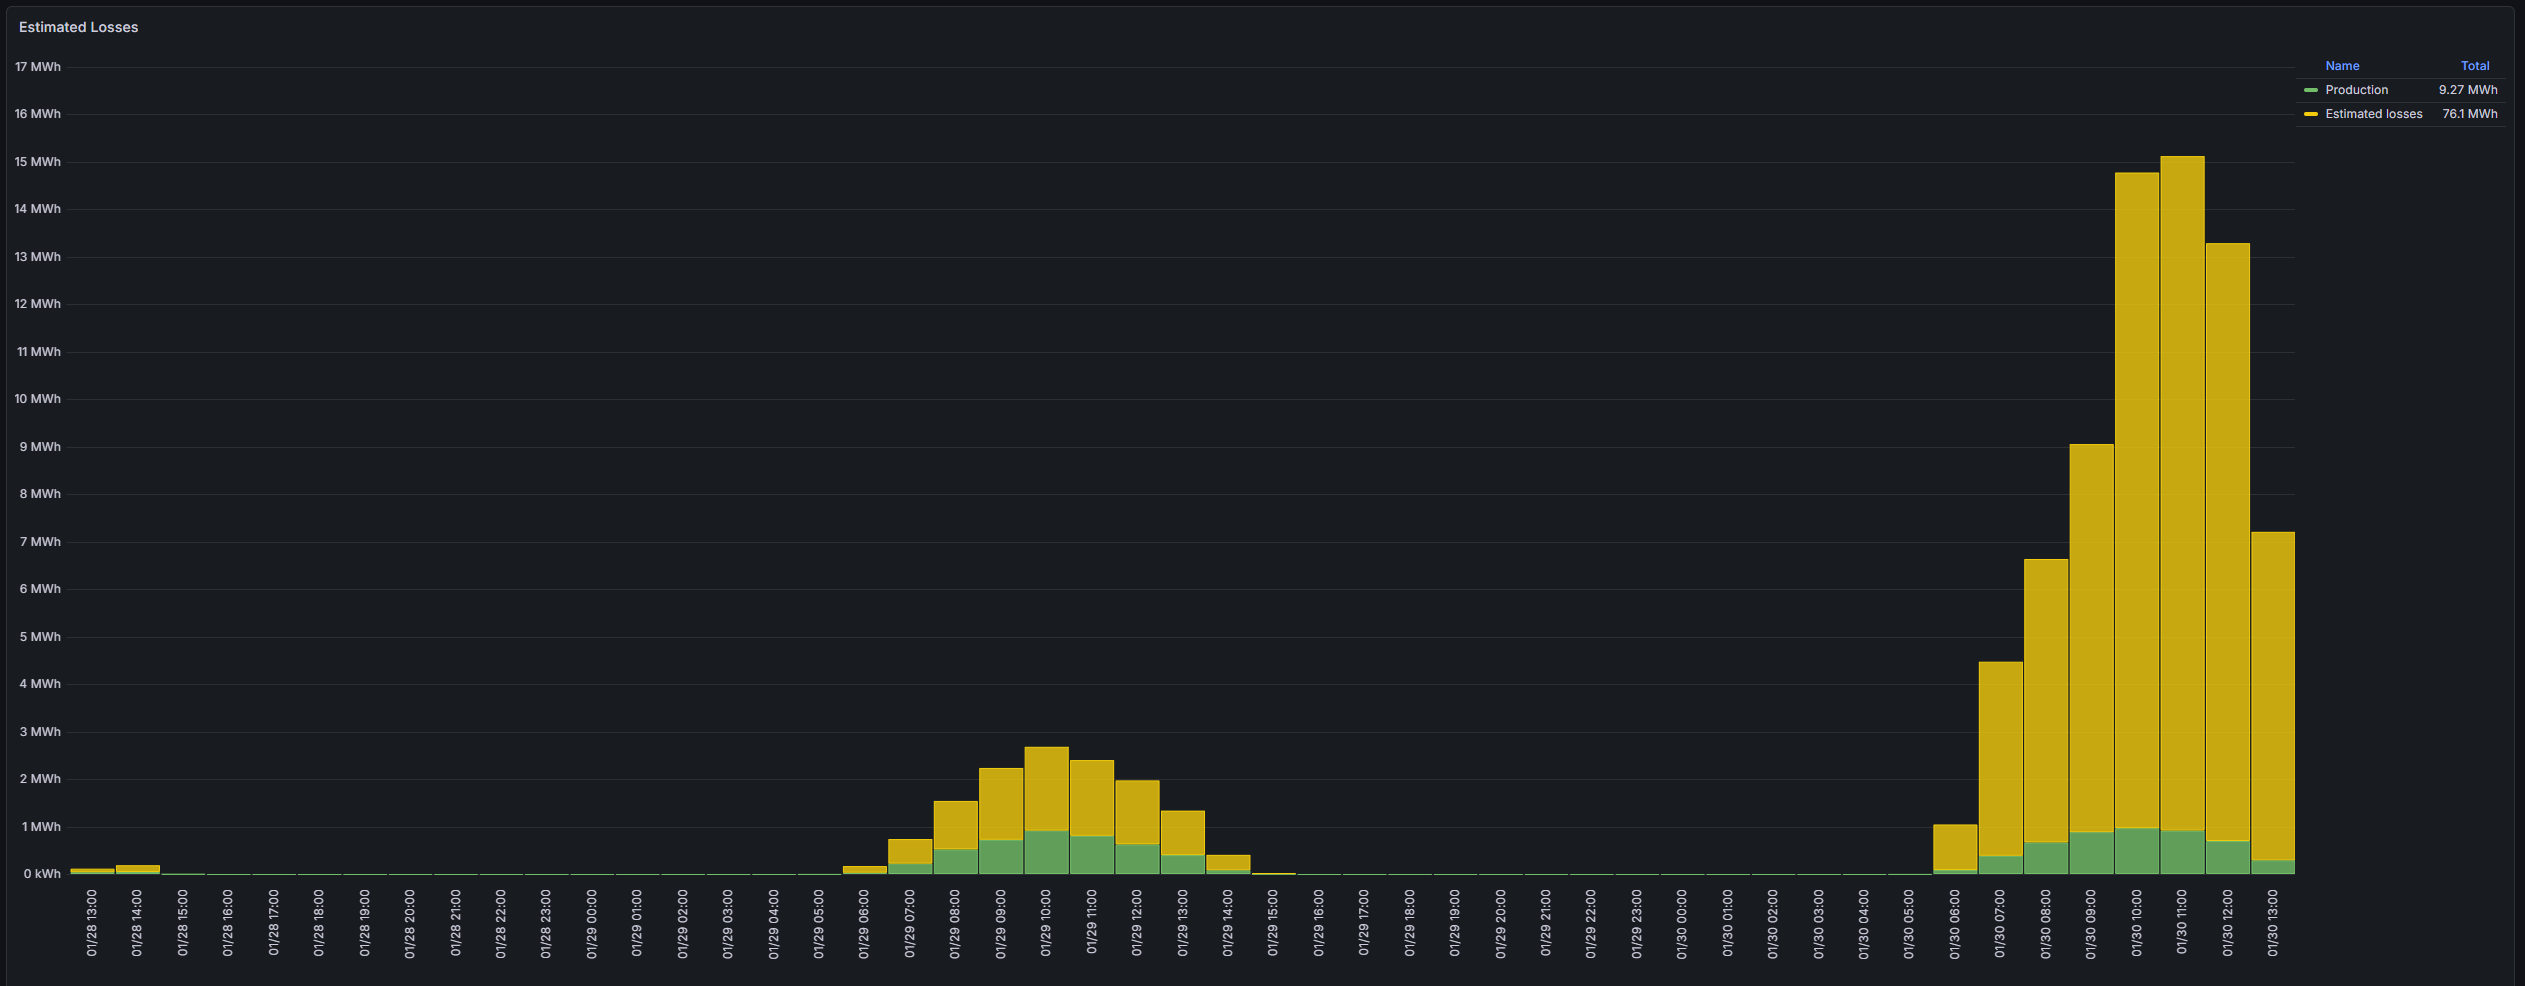
- Production (green) — energy actually delivered during the selected period.
- Estimated losses (yellow) — energy that could have been produced without curtailment or limiting.
- Total values — cumulative production and cumulative estimated losses are shown in the legend.
How to read this: Tall loss bars indicate periods where the plant operated below its estimated potential. These may correspond to grid constraints, market-based curtailment, equipment limits, or operational strategies. Use this view as a high-level indicator before drilling into control, device, or source-specific pages.