¶ Overview
The Device Telemetry page is designed for deep-dive analysis of any monitored device (e.g., inverter, battery, wind unit, or other plant equipment) and its available signals. Select one or more devices, choose the telemetry signals you want to plot (AC/DC power, voltages, currents, relative values, power factor, temperature, etc.), and set the Interval (aggregation granularity). The chart then renders time-series traces for all selected items.
¶ Time Range & Interval
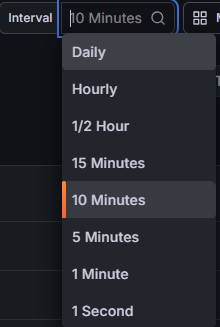
Use the Grafana time-picker and TSPI navigation (Today so far / Yesterday / step ⟵ ⟶). The Interval controls the data point frequency and aggregation (1 second, 1 minute, 5–15 minutes, Hourly, Daily, etc.). Smaller intervals show more detail but may reduce performance over long ranges.
¶ Select devices & signals
¶ Device selection
Use the Device selector to choose the device(s) you want to inspect. Multi-select is supported so you can compare several devices side-by-side (for example, multiple inverters, multiple battery units, or wind devices).

¶ Telemetry signals (Details)
Use the Details selector to choose which telemetry signals are plotted. You can select multiple signals at once; each additional signal increases the number of traces.

Performance warning: Selecting many devices and high-cardinality signals (for example, string-level DC current/voltage or per-phase values) can generate hundreds of traces. This may slow down or crash the browser on lower-spec machines. Start with a few devices and add signals gradually.
¶ Telemetry chart
The chart is time-based. Each selected device is plotted as separate trace(s). For signals that expose multiple channels (for example, per-phase or string-level telemetry), each channel is plotted as its own trace. Use the legend to toggle lines. Per-trace Mean and Max summarize the selected time window.
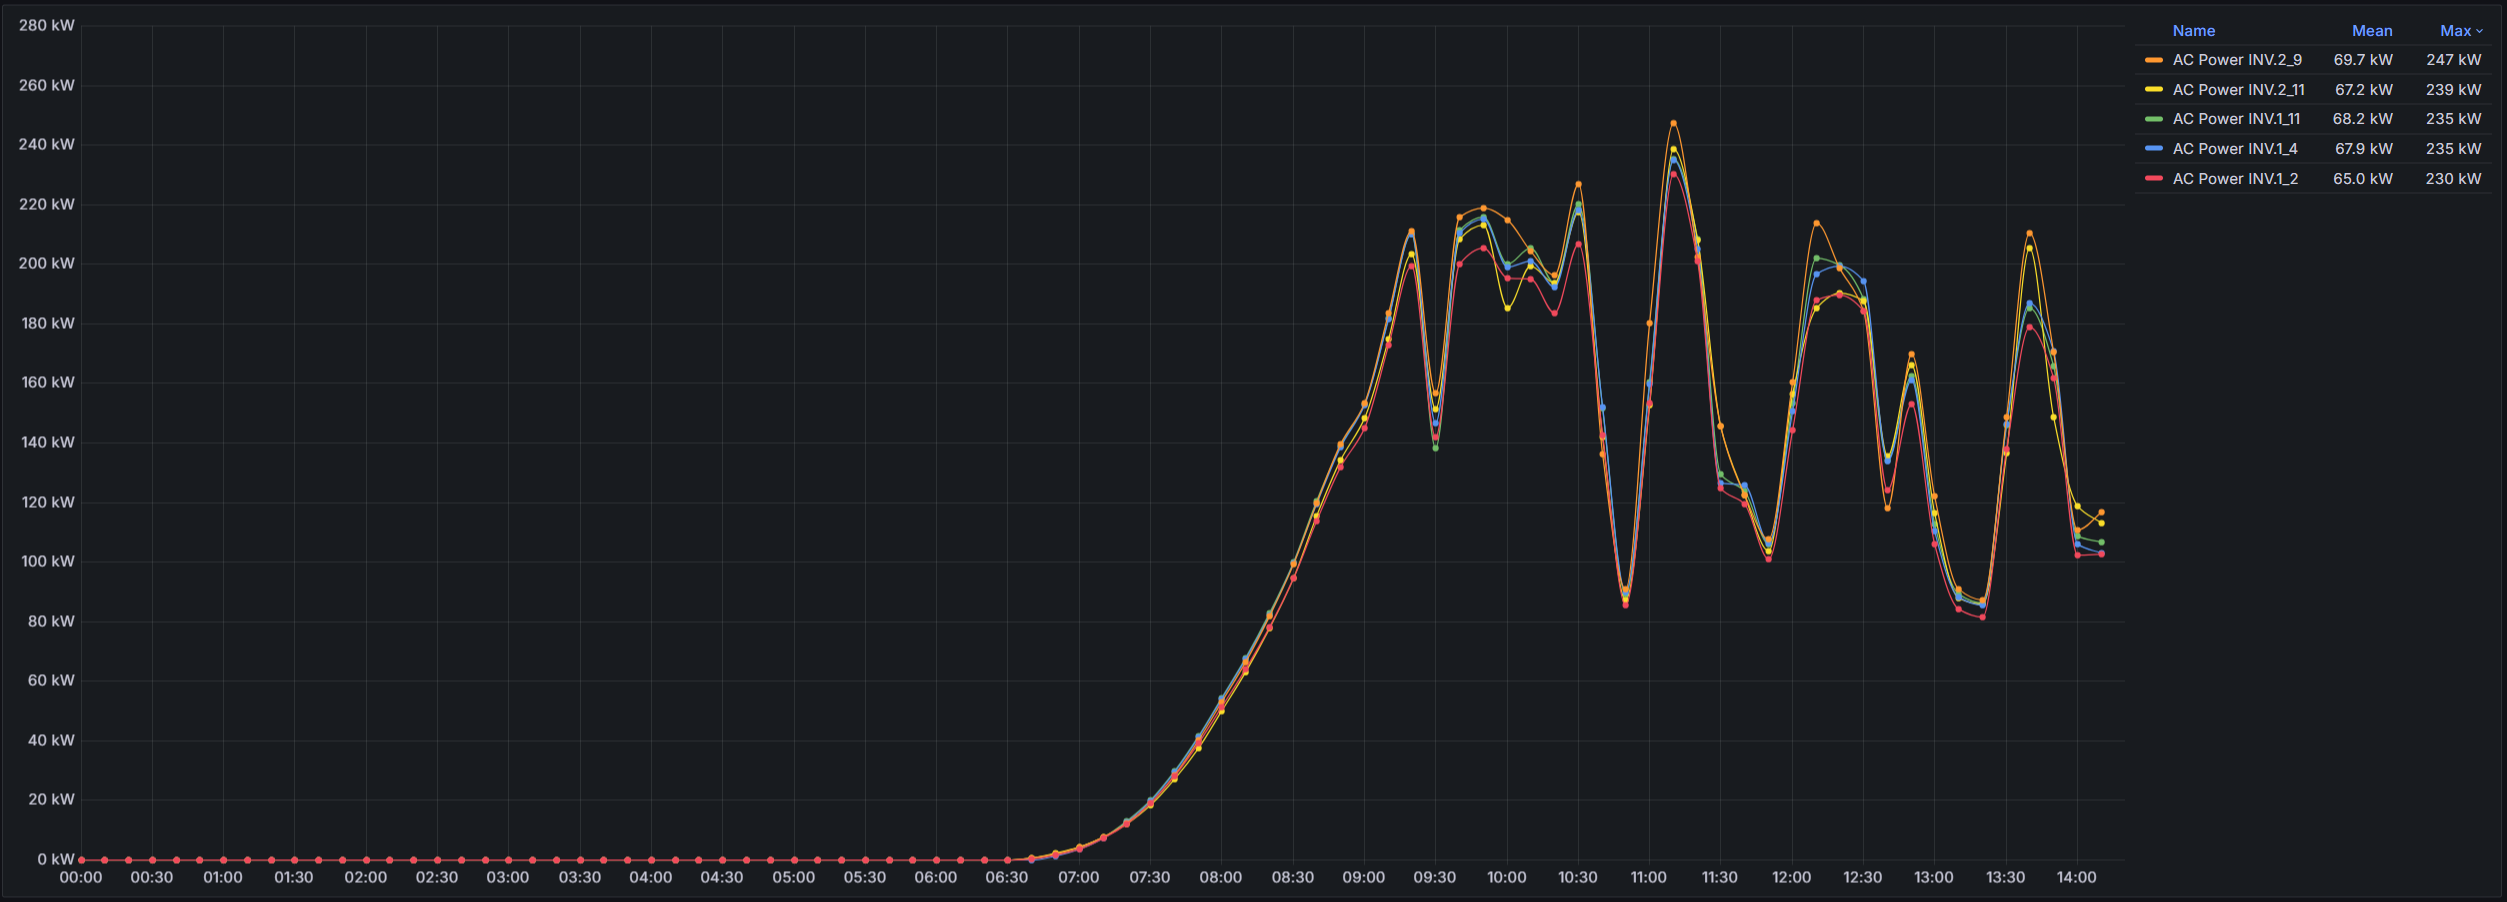
Tip: Start with a single, high-level signal (for example AC Power or DC Power) to establish baseline behavior, then add more detailed signals (per-phase, relative values, or string-level telemetry) to isolate the root cause.
¶ Signal guide (solar inverter selections)
The exact signal list depends on the selected device type. Below are commonly used telemetry signals and what they help diagnose:
- AC Power — device active power on the AC side (kW). Best first check for limiting, curtailment, ramps, or instability.
- AC Voltage (phase) — phase voltages. Use to identify grid events, imbalance, or protection triggers.
- AC Voltage (linear) — line-to-line voltages. Useful for imbalance and transformer/tap-change context.
- AC Current (device) / AC Current (phase) — current behavior (total or per-phase) for imbalance checks and thermal/protection investigation.
- DC Power — total DC input power (where applicable). Compare to AC Power to understand conversion losses or clipping.
- DC Current — channel currents (often string-level for PV). Find weak/missing channels, mismatch, soiling/snow effects.
- DC Voltage — channel voltages (often string-level for PV). Detect open circuits, disconnects, wake/sleep behavior.
- Relative DC Current — normalized current for outlier detection under changing operating conditions.
- Power factor — reactive behavior indicator; useful for Q-control and compliance investigation.
- Temperature — thermal context for derating, trips, and performance limitations.
Note: If a selected device does not support a chosen signal, that trace may be absent or remain flat. Select fewer signals and confirm device type when troubleshooting missing data.