¶ Overview
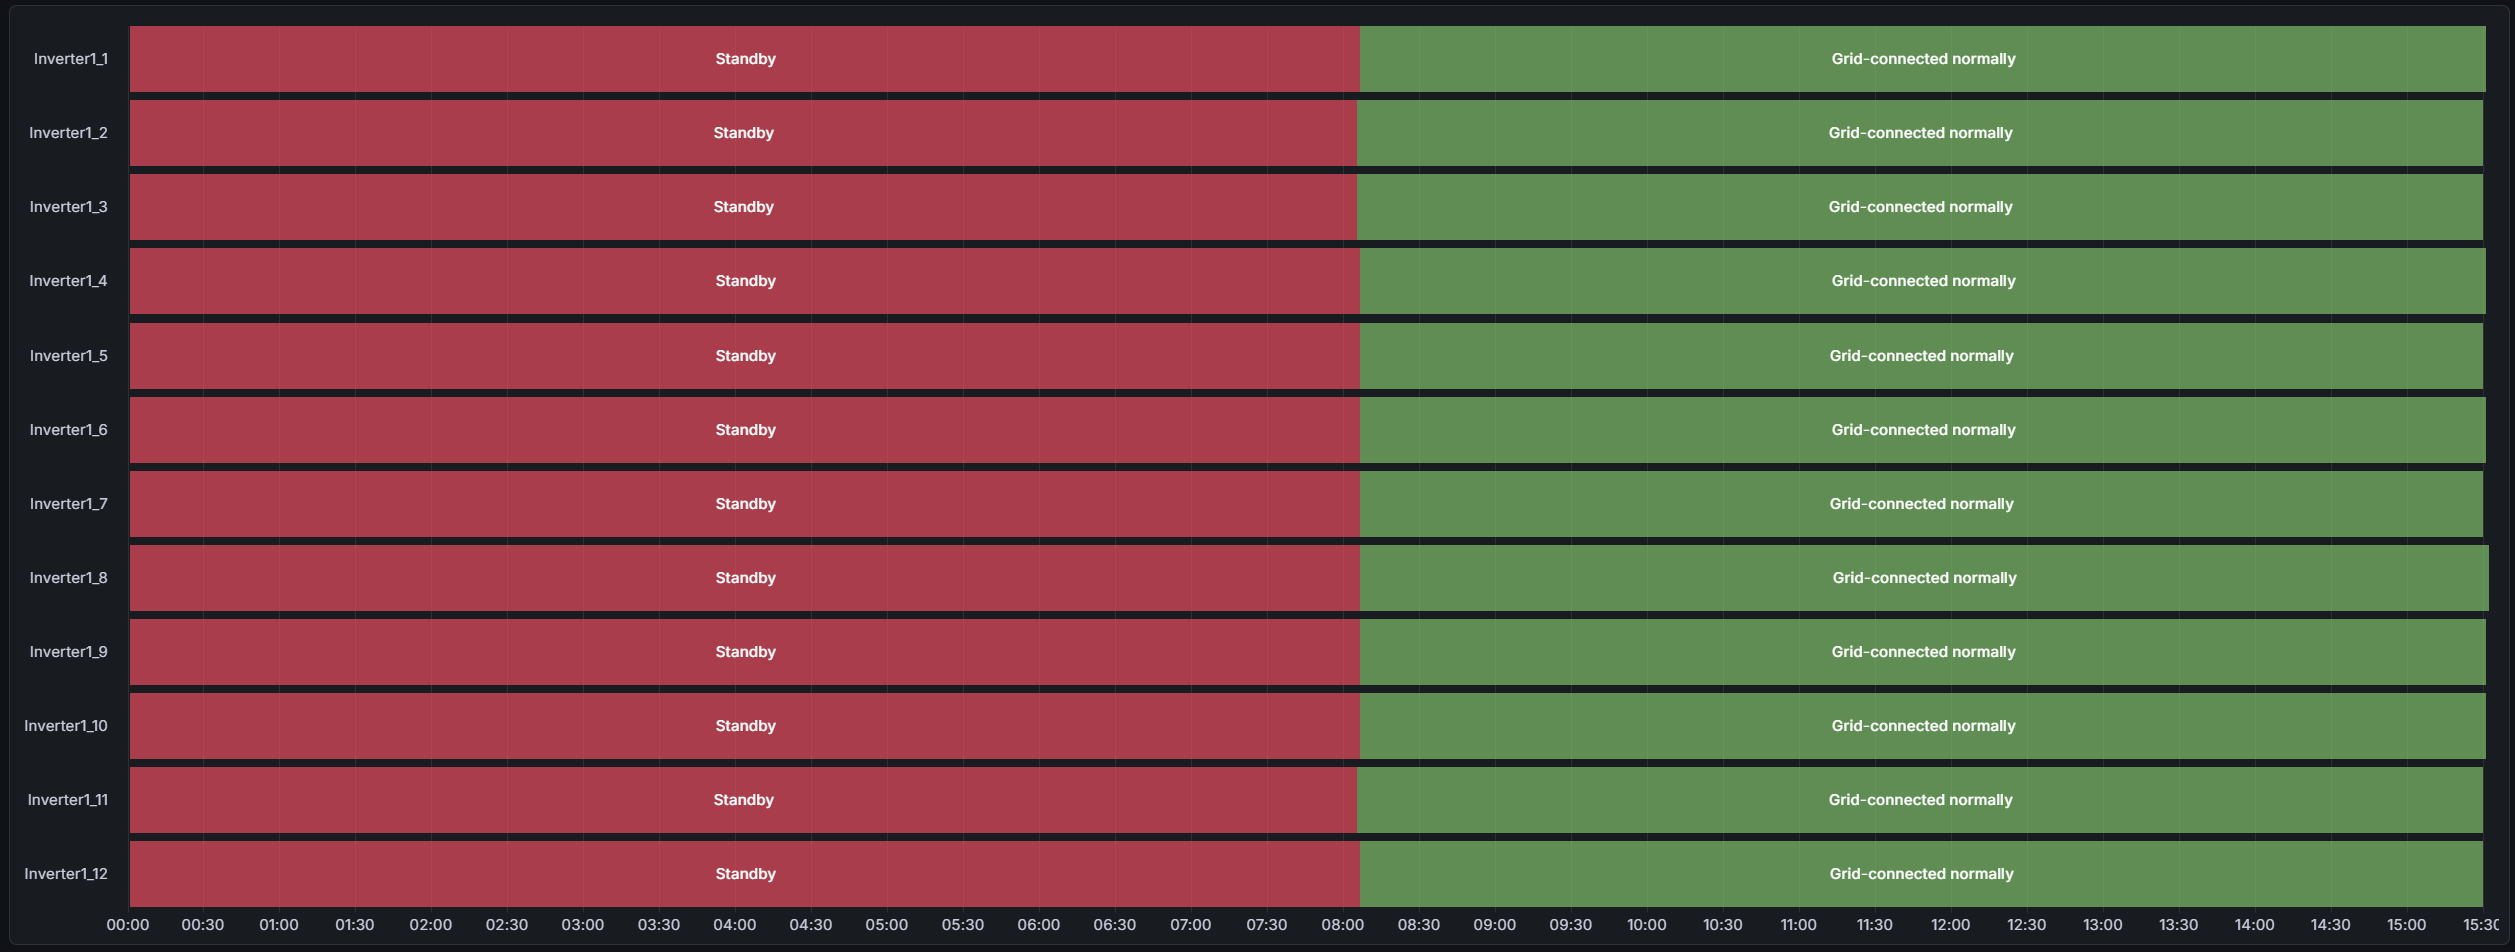
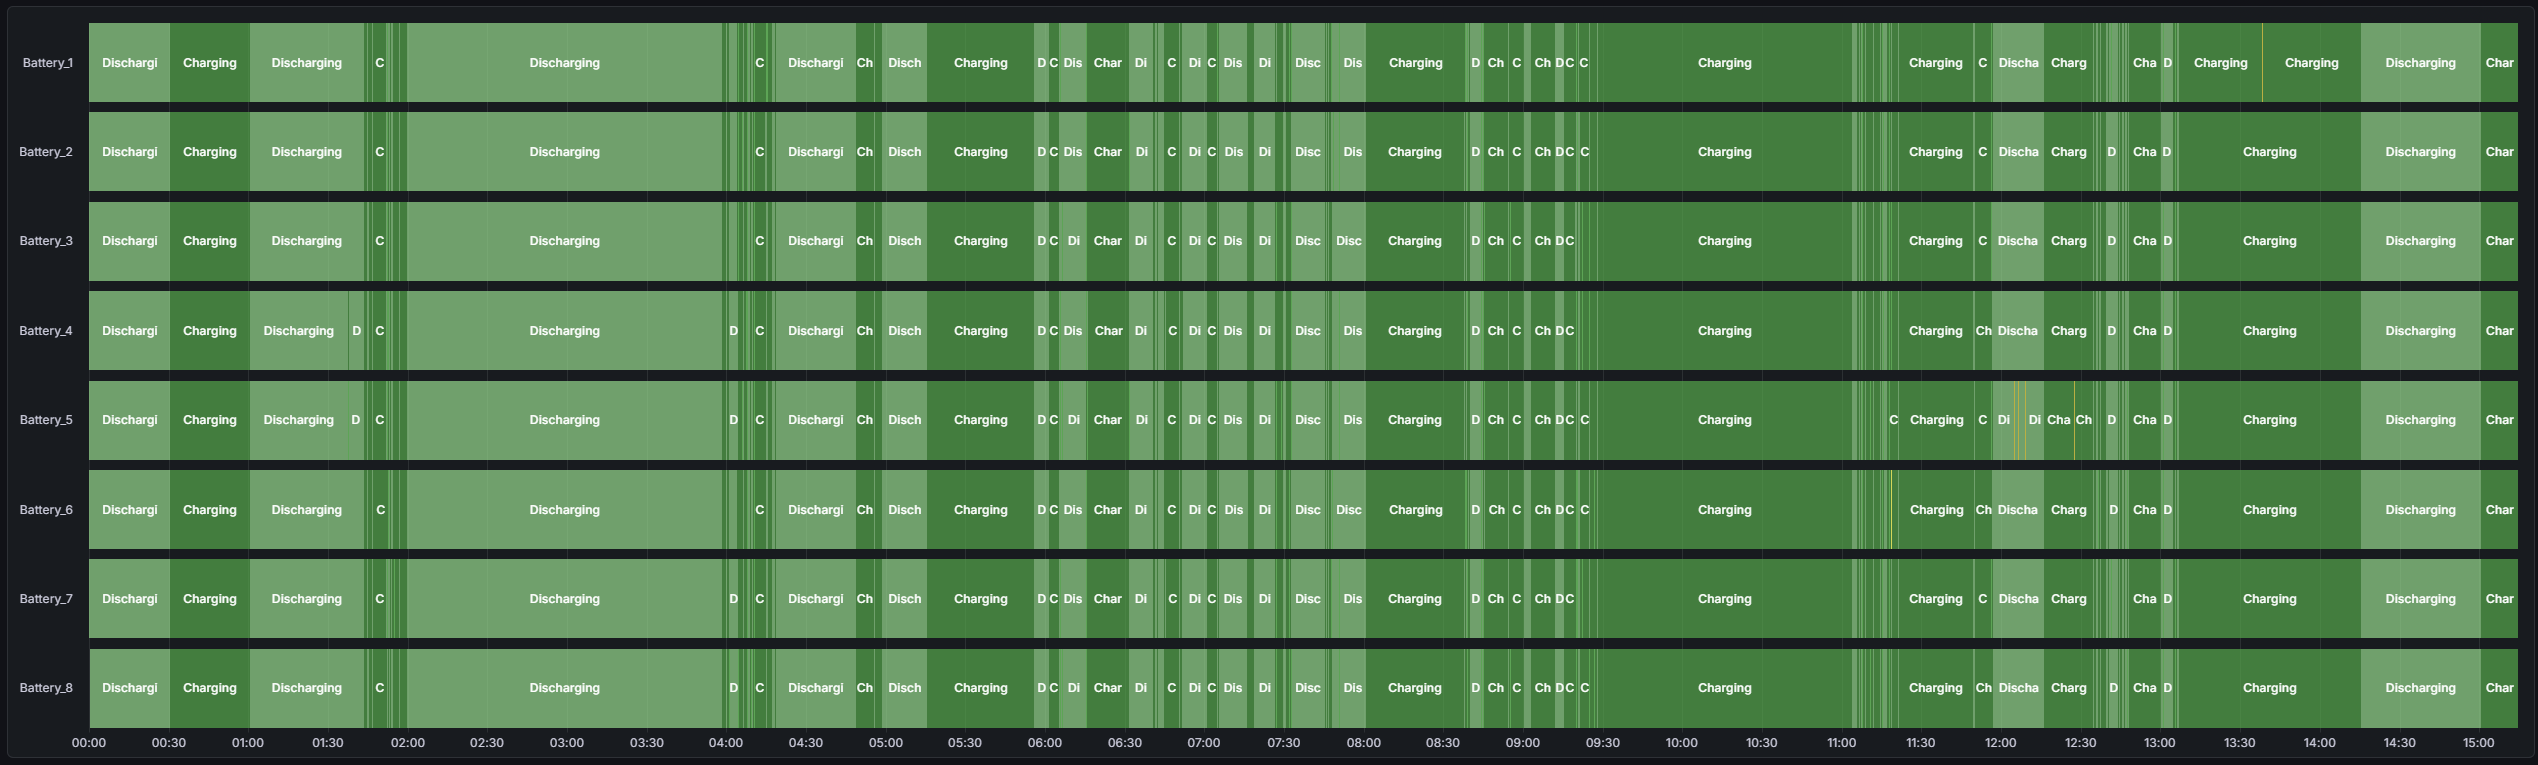
The Device Status page displays a state timeline for selected devices (e.g., batteries, inverters, wind units, or other equipment). Each device is visualized as a horizontal bar where each segment represents how long the device spent in a specific operating mode (for example Charging, Discharging, Standby, or Grid-connected) throughout the chosen time range. You can select multiple devices to compare behavior side-by-side.
Tip: Use this page to confirm synchronized operation across devices, detect downtime, and spot unusual switching patterns (frequent mode flips, long idle windows).
¶ Select device group (optional) & devices
If an MT selector is available on your site, use it to choose the Modular Transformer bay (e.g. MasterX) whose devices you want to inspect. After choosing an MT, the device list will automatically filter to show only devices connected to that MT.
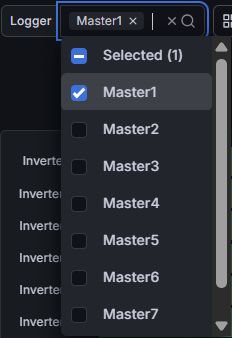
Note: Some deployments do not show an MT selector.
¶ Status timeline chart
The status chart displays each selected device’s operational mode over time. Each colored segment represents a state. Hover any segment to see the state name and the duration it lasted within the selected time range.
- Y-axis: Lists all selected devices.
- X-axis: Shows the time range defined by the Grafana time-picker.
- Segments: Each segment corresponds to a device state (mode).
- Hover: Reveals state name and duration for the segment.
¶ Example: Battery device status
In battery-focused views, the timeline typically shows state changes such as Charging and Discharging. Frequent transitions can indicate dispatch cycling, SoC limits, or control behavior that warrants review in the Battery telemetry pages.
¶ Insights & use cases
- Startup validation: Confirm devices transition from idle/standby to normal operation at expected times.
- Downtime detection: Identify devices that remain offline, idle, or in fault/blocked states longer than peers.
- Control verification: Validate dispatch patterns (e.g., battery charge/discharge windows) and detect excessive switching.
- Maintenance review: Correlate service events with extended non-operational states.
Tip: If you see repeated short segments (rapid state flips), zoom in with the time picker and use a smaller interval to pinpoint the exact transition times.