¶ Overview
The Grid Details page is designed for in-depth analysis of grid-side telemetry. It provides access to all grid analyzers and meters connected to the plant, allowing operators to inspect electrical behavior at key connection points such as the POI, feeders, or substations.
This page is primarily used for diagnostics, verification, and reporting, with full control over which meters, which signals, and which data resolution are displayed.
¶ Configuration controls
¶ Meter selection
Use the Meter selector to choose one or more analyzers (for example, Meter_1). Each meter typically represents a physical grid analyzer installed at a specific electrical connection point.
¶ Interval (data resolution)
The Interval setting defines the sampling and aggregation period (for example, 1 second). Short intervals provide higher detail, while longer intervals smooth the signal and improve readability over long time ranges.
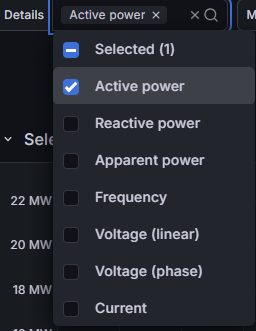
¶ Signal selection
The Details menu lets you select which electrical quantities are displayed. Multiple signals can be enabled simultaneously for comparison.

- Active power (MW)
- Reactive power (MVAr)
- Apparent power (MVA)
- Frequency (Hz)
- Voltage (linear or per phase)
- Current (A)
¶ Telemetry graph & statistics
Once meters, interval, and signals are selected, telemetry is rendered as a time-series graph. Each trace represents a selected signal from a selected meter.
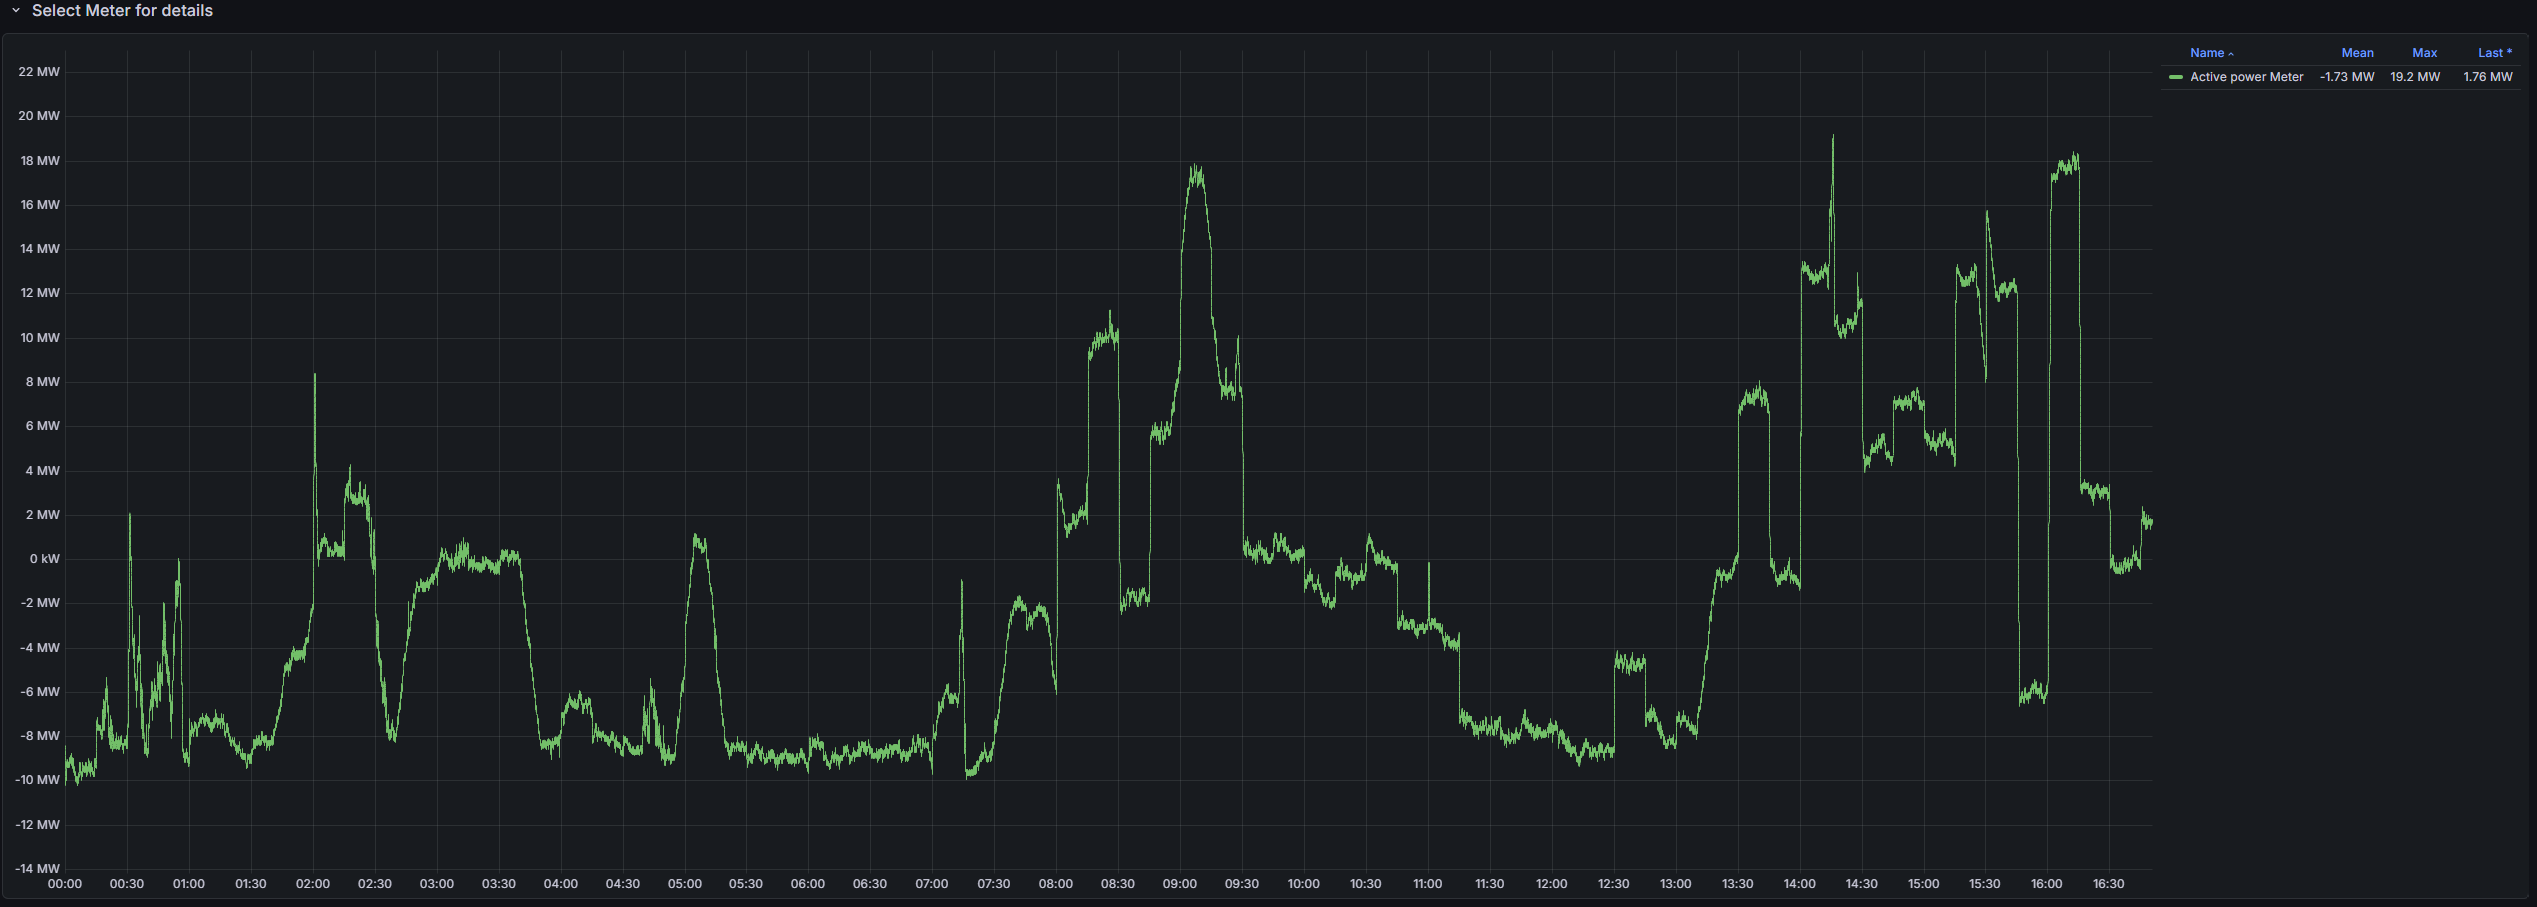
For each displayed signal, the following statistics are calculated over the selected time range:
- Mean — average value
- Max — highest measured value
- Last — most recent value
Note: Statistics update automatically when the time range, interval, meter selection, or signal selection changes.
¶ Typical use cases
- Verify active and reactive power exchange at the POI.
- Analyze frequency and voltage behavior during grid events.
- Compare telemetry from multiple analyzers at different connection points.
- Support compliance checks and detailed troubleshooting.