¶ Overview
Scheduling allows operators to plan plant curtailment for Today or Tomorrow in MWh / 15-minute intervals. Typical uses include matching trader commitments and market requirements or executing operational strategies.
Note: Scheduling values are converted to MW setpoints by dividing MWh by 0.25 h (15 minutes). The PPC applies the MIN rule: the scheduled setpoint is compared to other active restrictions (TSO, User, NordPool, MT limiting), and the lowest value becomes the Final Active SP.
Safety: If Scheduling is enabled but no plan is provided, the scheduler setpoint is ignored by the PPC as a precaution.
¶ Controls
The main scheduling panel is a matrix input table. Hours (00–23) run horizontally, and each hour is divided into four 15-minute intervals (00 / 15 / 30 / 45).
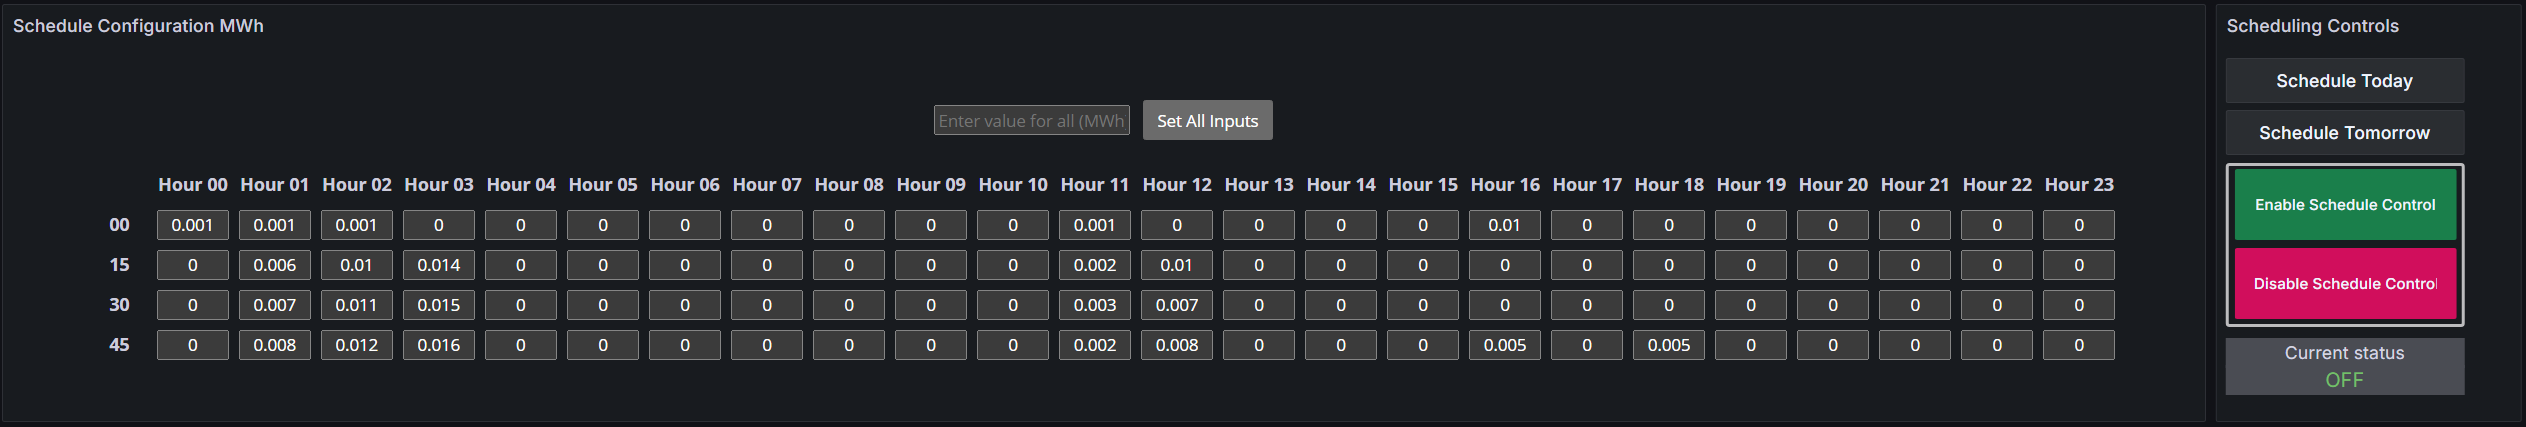
- Matrix input — enter MWh values for each 15-min block.
- Set All Inputs — fill the entire day with a single value for fast setup.
- Schedule Today / Schedule Tomorrow — choose which day to apply.
- Enable Schedule Control — activates the schedule in the PPC.
- Disable Schedule Control — cancels the schedule; PPC reverts to other limits.
- Status indicator — shows whether Scheduling is currently ON or OFF.
Paste from Excel/CSV: Click inside the schedule panel and press Ctrl/Cmd + V. The table will automatically populate with the copied 4×24 values. Paste only numeric MWh values.
¶ Excel / CSV template
Template matching the Scheduling matrix.
| Hour 00 | Hour 01 | Hour 02 | Hour 03 | Hour 04 | Hour 05 | Hour 06 | Hour 07 | Hour 08 | Hour 09 | Hour 10 | Hour 11 | Hour 12 | Hour 13 | Hour 14 | Hour 15 | Hour 16 | Hour 17 | Hour 18 | Hour 19 | Hour 20 | Hour 21 | Hour 22 | Hour 23 | |
|---|---|---|---|---|---|---|---|---|---|---|---|---|---|---|---|---|---|---|---|---|---|---|---|---|
| 00 | 10 | 10 | 10 | 10 | 10 | 10 | 10 | 10 | 10 | 10 | 10 | 10 | 10 | 10 | 10 | 10 | 10 | 10 | 10 | 10 | 10 | 10 | 10 | 10 |
| 15 | 10 | 10 | 10 | 10 | 10 | 10 | 10 | 10 | 10 | 10 | 10 | 10 | 10 | 10 | 10 | 10 | 10 | 10 | 10 | 10 | 10 | 10 | 10 | |
| 30 | 10 | 10 | 10 | 10 | 10 | 10 | 10 | 10 | 10 | 10 | 10 | 10 | 10 | 10 | 10 | 10 | 10 | 10 | 10 | 10 | 10 | 10 | 10 | |
| 45 | 10 | 10 | 10 | 10 | 10 | 10 | 10 | 10 | 10 | 10 | 10 | 10 | 10 | 10 | 10 | 10 | 10 | 10 | 10 | 10 | 10 | 10 | 10 | 10 |
Example (copy/paste): Create a 4×24 table in Excel. Click inside the TSPInsight Scheduling panel and press Ctrl/Cmd + V. The table auto-populates. The PPC converts each block to
40 MW(10 * 0.25) for the respective 15-minute interval.
¶ Graphs & Feedback
After enabling the schedule, the planned profile appears in the feedback graph for a quick visual check. Use it to verify that the entered MWh values create the intended MW shape and that there are no gaps or spikes.
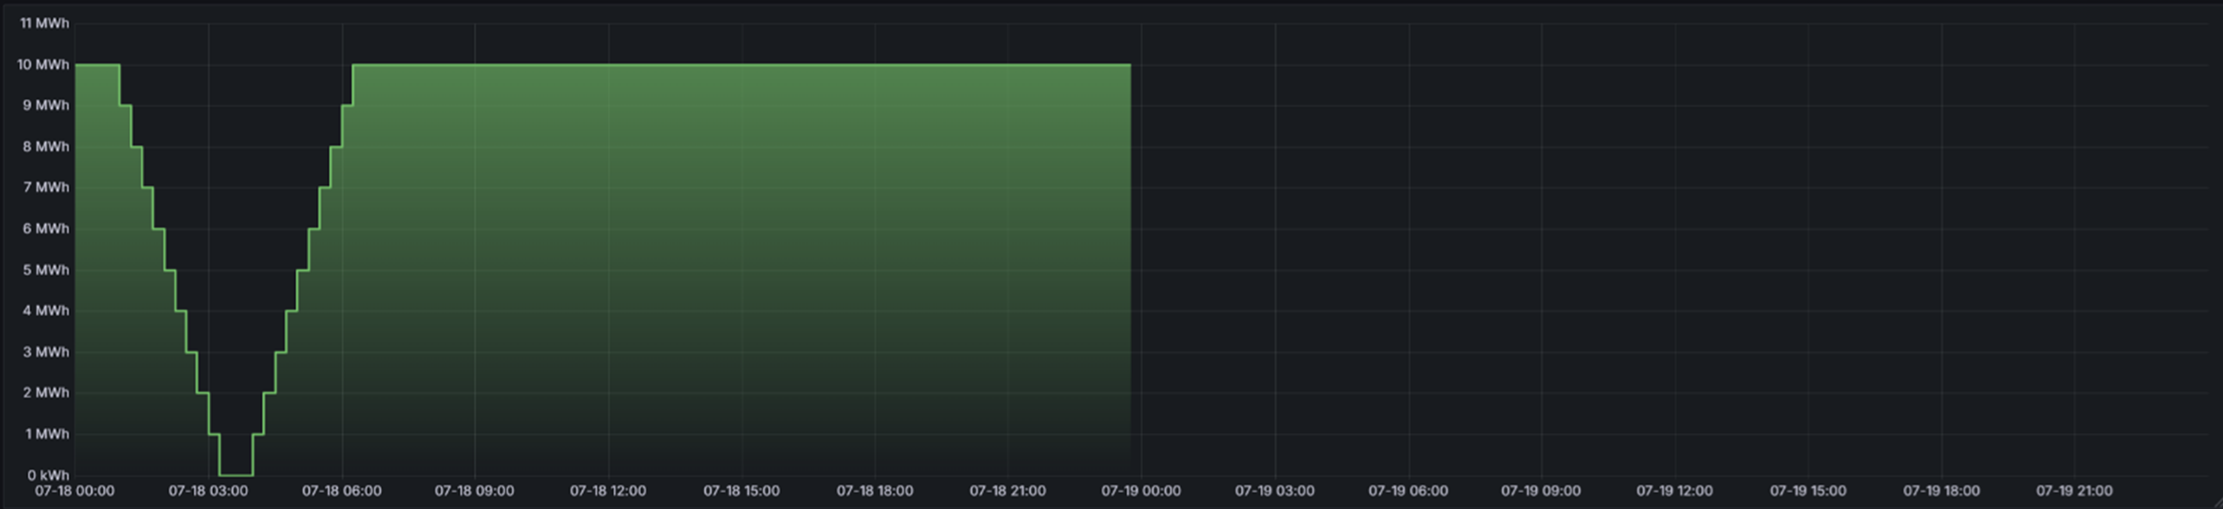
Example (shape): A constant
10 MWhper block appears as a flat line at ~40 MWacross the day. To create ramps, increase/decrease adjacent blocks (e.g., 6 → 8 → 10) and verify the stair-step shape here.