¶ TSPInsight Overview
Grafana dashboards are time-series first. Control time with the native Grafana time-picker (top-right) and with the TSPI time navigator (center-top, just below the menu line). Data does not auto-refresh — click Refresh whenever you change the time range. Visuals are sourced from the InfluxDB time-series database; Grafana renders that data for you.
¶ Menu line (navigate TSPInsight)
Use the menu line to jump between dashboards: Inverter Details, Meteo Details, Production Details, MT, Control, and Alarms. It’s located at the very top of the main page.

¶ Time controls
¶ Grafana time-picker (top-right)

- Select a range: click the time-picker → choose a preset (Today so far, Yesterday, Last 7 days, Last month) or set a custom range.
- Type by hand: enter exact start/end date-times.
- Shift the window: use the small left/right arrows beside the time-picker.
- Refresh: click Refresh to fetch data for the current window (TSPInsight does not auto-refresh).
¶ TSPI time navigator (center-top, below the menu line)


- Slide through days (arrows at the start and end) and jump quickly using the most common shortcuts.
- Use the preset buttons Today, Yesterday, Last week, This month, Last month, This year, Last year as a shortcut to change the time period without opening the Grafana time-picker.
- Sits above all panels, center-top, under the menu line.
¶ Panel filters & interval
Many panels expose quick filters and an aggregation interval right above the chart. In the example: metric = AC Power, MT = MT1 (Modular Transformer), and inverters 1–6 selected; interval = 10 minutes.

¶ Working with series (legend)
- Isolate a series: click its name in the legend → shows only that series. Click again to restore others.
- Toggle one series: Ctrl/Cmd + click a legend label → hide/show just that series without touching the rest.
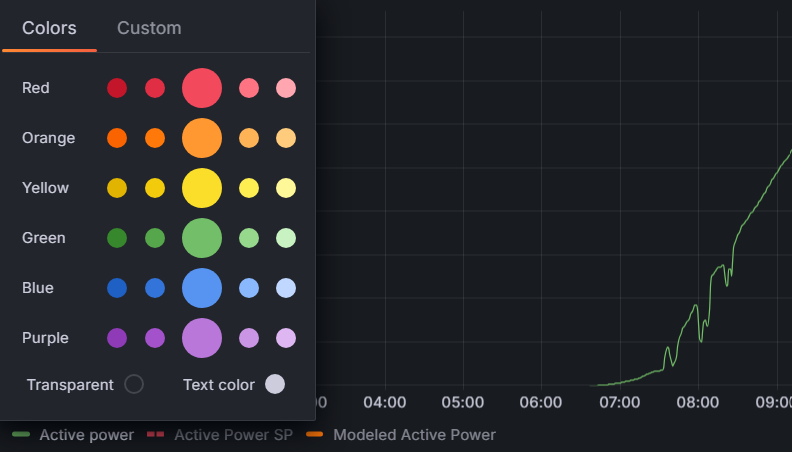
- Re-color: click the colored dot in the legend to pick a clearer color for that trace.
- Zoom: on any panel, click-drag to zoom into a time window; use the time-picker arrows or Ctrl/Cmd + Z to step back out.
¶ Inspect & export data (CSV)
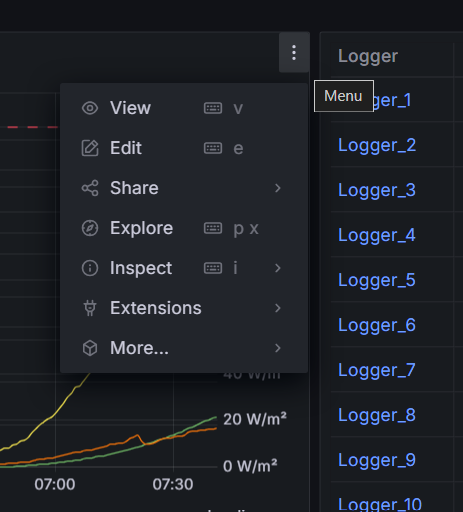
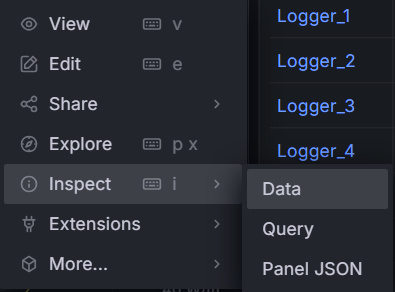
Use the panel menu (three dots) to inspect the underlying time-series and export a CSV for reporting. Progression: open the panel menu → choose Inspect → pick Data → preview → Download CSV.
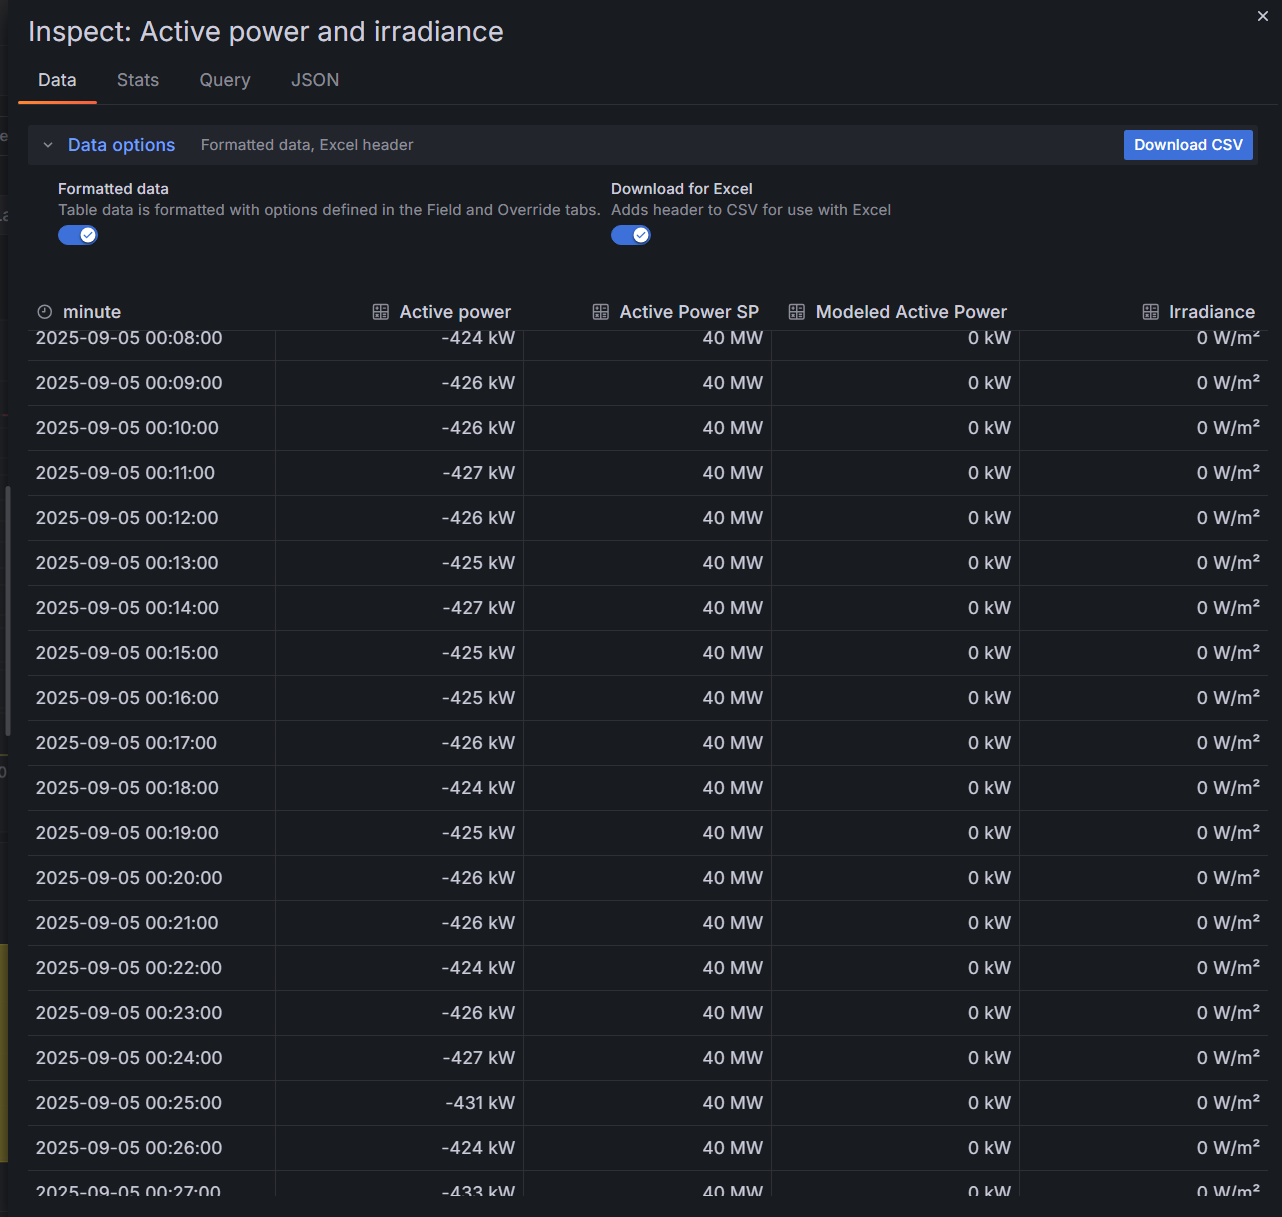
- Download CSV: exports the table. Enable “Excel header” if you’ll open it in Excel to get clean column names.
- Other tabs: Stats (summary), Query (data source query), JSON (panel definition) — useful for audits.
¶ Controls & setpoints (how actions are sent)
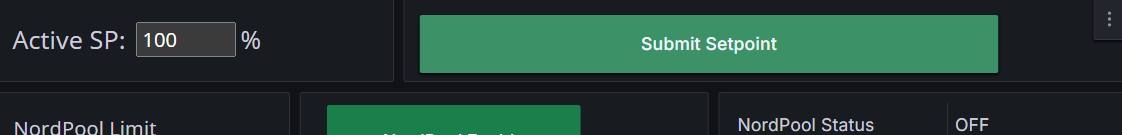
On Control pages you’ll see large buttons and input fields (e.g., Active SP %). Changing the values or options does not immediately command the plant. Prepare your configuration first, then press the assigned action button (e.g., Submit Setpoint) to send commands to the PLC.
Behind the scenes, the call goes Grafana → TSPI API → PPC (MINI or MAXI) to control the park. If the command succeeds, a green banner appears in the top-right. If it fails, a red banner appears — in that case, note the message and contact TSPI support.
¶ Quick interactions & shortcuts
- Zoom in: click-drag on a panel.
- Step through time: use the arrows by the time-picker.
- Isolate series: click a legend label (click again to restore).
- Toggle one series: Ctrl/Cmd + click a legend label.
- Re-color: click the legend’s color dot.
- Refresh data: press Refresh after changing time.
¶ More help
¶ Glossary (signals, systems, market terms)
¶ Core measurements & setpoints
- P (Active Power) — real power exported at POI (kW/MW).
- Q (Reactive Power) — reactive exchange to support voltage (kVAr/MVAr).
- S (Apparent Power) — vector combination of P and Q (kVA/MVA).
- PF (Power Factor) — P/S (unitless). Not shown in the main reactive panel here.
- SP (Setpoint) — commanded target. Active Power SP is a % of available/export capability; Reactive Power SP is Q in kVAr/MVAr; Voltage SP is kV at POI.
- Export limit — maximum permitted P at POI (market/grid rule).
- Ramp rate — allowed change rate of P (MW/min or %/min).
- Irradiance — solar resource (W/m²).
- Modeled power — expected P curve used for performance context.
¶ Assets & architecture
- POI (Point of Interconnection) — grid connection & control reference.
- MT (Modular Transformer) — transformer-level block; measured by a logger.
- Logger — device/data source recording MT metrics (e.g., AC power).
- Inverter — PV DC→AC conversion and P/Q control capabilities.
- BESS — battery energy storage system.
- PCS — power conversion system (inverter for BESS).
- BMS — battery management system (SoC, limits, alarms).
- SoC — state of charge (%).
- PPC MINI / MAXI — plant controllers used for A–C (≤15 MW) and D (≥15 MW) sites.
- EMS / SCADA (TSPInsight) — monitoring, alarms, historian, reporting, remote control.
- InfluxDB — time-series database where TSPInsight stores metrics; Grafana reads from here.
- Redundancy — duplicated communications or services to improve availability (e.g., dual links, failover nodes).
¶ Control states & indicators
- Maintain Q — hold reactive power at a setpoint (kVAr/MVAr).
- Maintain U (Voltage) — hold POI voltage at a kV setpoint.
- P limiting — active power limiting is engaged.
- Primary regulation — plant responding to frequency signals (site-specific integration).
- POD (Power Oscillation Damping) — damping function state.
- Synthetic inertia — converter-based inertial response state.
¶ Market & TSO integrations
- Nord Pool limiting — market-linked export cap enforced at POI.
- aFRR — Automatic Frequency Restoration Reserve (automatic control signal integration, where applicable).
- mFRR — Manual Frequency Restoration Reserve (dispatchable balancing product).
- FCR — Frequency Containment Reserve.
- FCM — Capacity/Flexibility commitment mechanisms, as supported by your trader/TSO integration.