¶ Overview
The Specific Production view helps operators and engineers evaluate the relative performance of each inverter or modular transformer (MT). Instead of showing absolute energy, it normalizes production to installed capacity, allowing fair comparison across devices of different ratings.
This page provides two main insights:
- Specific Production — actual production per unit of installed power (kWh/kWp).
- Deviation — the relative difference of each device compared to the plant median.
Time-based calculations: All values on this page are computed for the currently selected time range. Use the Grafana time-picker (top-right) and navigation arrows to change the time frame, then press Refresh. Zooming, stepping, and other time controls behave the same as on other TSPInsight pages.
¶ Source Selection
Use the Source picker to select which type of analysis to display. You can choose from:
- Inverters — individual inverter specific production.
- Inverter deviation — performance difference of each inverter vs. the median inverter.
- MT — aggregated specific production for each Modular Transformer.
- MT deviation — deviation of each MT from the plant’s median performance.
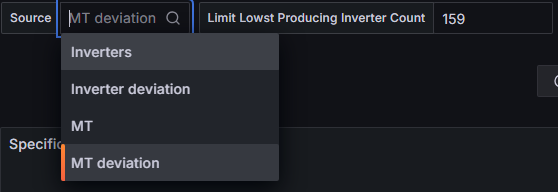
Tip: Use the limiter control next to the source selection to filter the number of devices displayed. This is useful to focus on the worst-performing inverters or lowest-producing MTs.
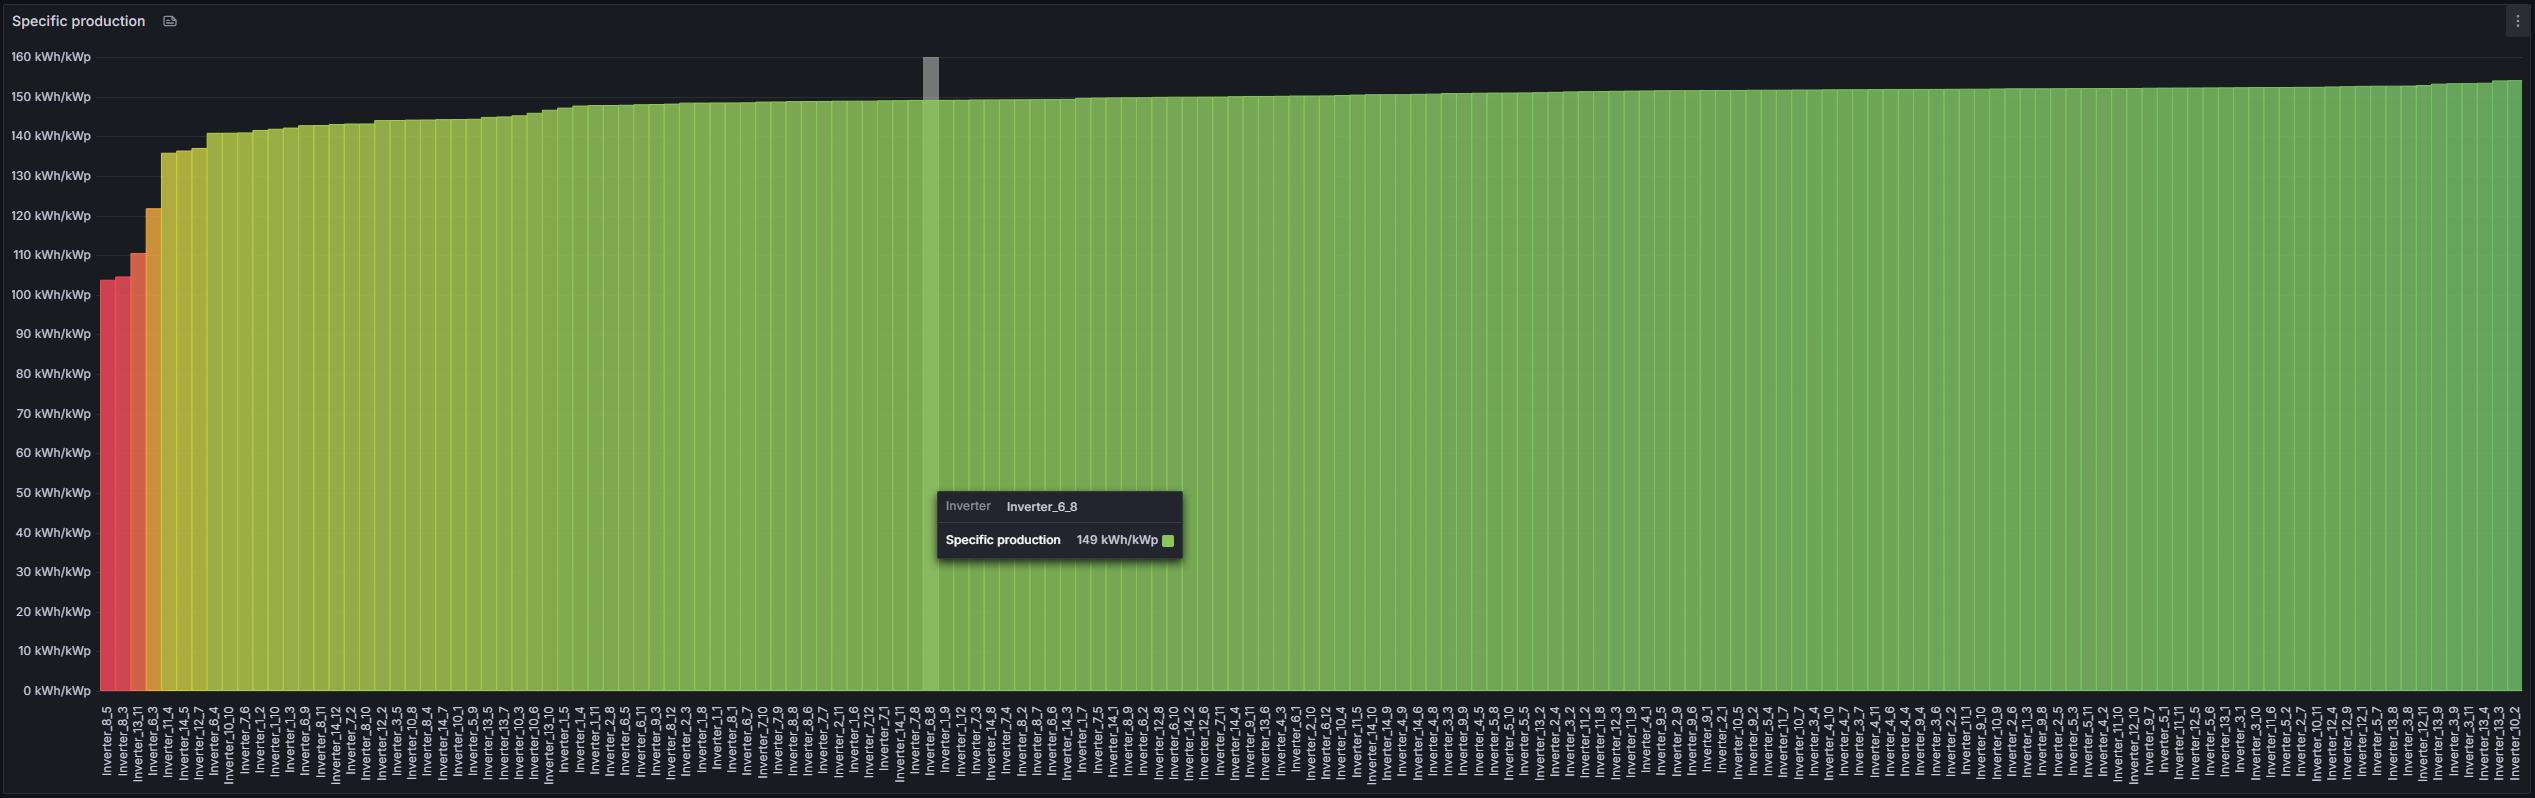
¶ Specific Production
Specific production is calculated as:
Specific Production = Produced Energy (kWh) ÷ Installed Power (kWp)
This allows direct comparison between differently sized devices. Well-performing devices cluster together, while underperforming ones appear lower on the chart. Devices with much lower values may indicate faults, disconnections, shading, or derating.
¶ Deviation Analysis
Deviation analysis compares each device to the median performance of the plant. It shows the percentage difference from the median:
Deviation = (Device Specific Production − Median Specific Production) ÷ Median
Devices with negative values are underperforming, while those above 0% are overperforming. This provides a normalized way to identify problematic MTs or inverters without being biased by absolute size.
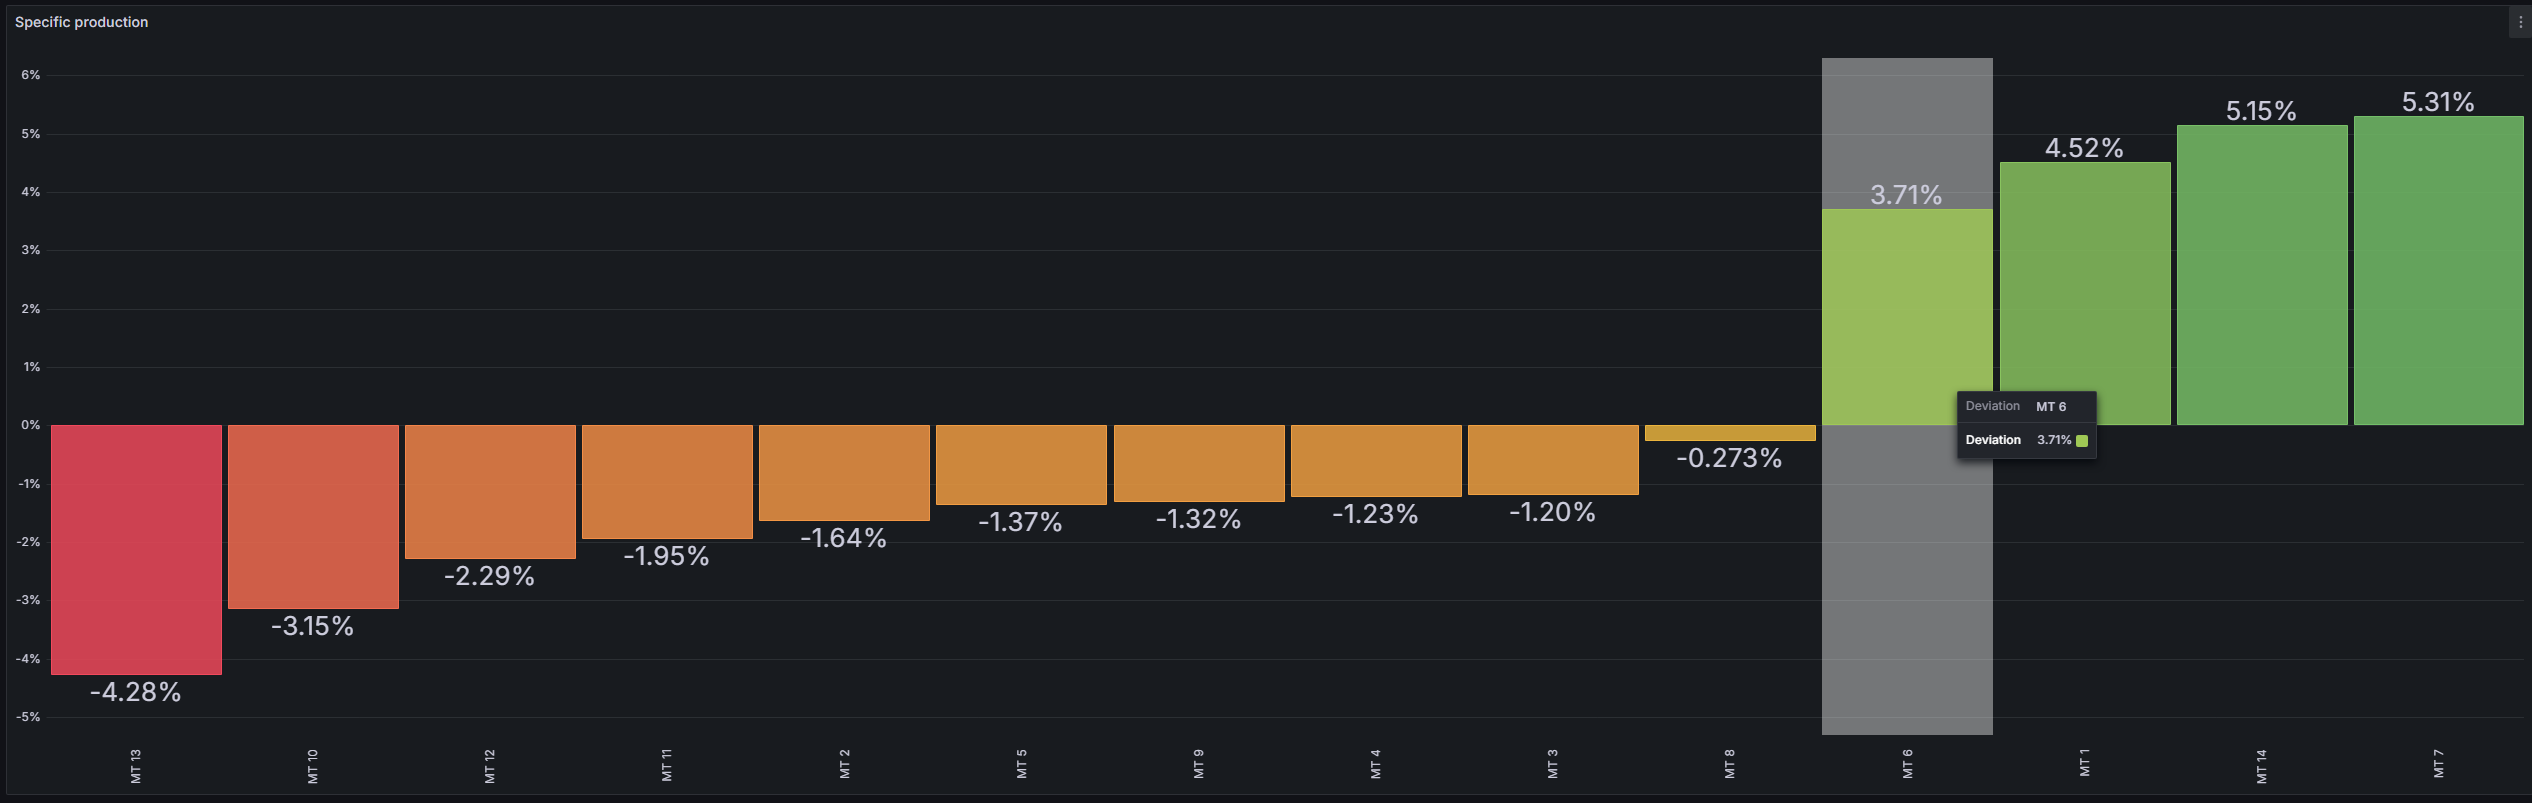
Note: Deviation analysis is especially helpful for fleet-wide benchmarking, showing which devices consistently fall behind or outperform the rest of the plant.