¶ Overview
The Device Production view shows energy (kWh/MWh) per device within the selected time range. Devices shown on this page depend on the active generation source:
- Solar — typically lists PV inverters and shows each inverter’s produced energy.
- Battery — lists battery units and shows energy per device (delivered/consumed may be available depending on configuration).
- Wind — lists wind devices and shows energy per device where telemetry is available.
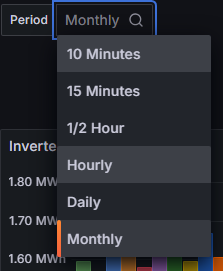
You control the aggregation period (granularity) with the Period selector, which determines how bars are grouped in time.
Time-based calculations: All charts on this page use the currently selected time range. Adjust the Grafana time-picker (top-right) and use the navigation arrows to step through time. Click Refresh after changing the window.
¶ Choose a period (granularity)
Use the Period control to aggregate production into equal time buckets. Available options: 10 Minutes, 15 Minutes, 1/2 Hour, Hourly, Daily, Monthly. Shorter periods reveal more detail; longer periods highlight broader trends.
¶ Device production bar chart
The chart groups bars by the chosen Period. For each time bucket, the production of each device is displayed as a separate bar, enabling quick comparison and pattern spotting (e.g., consistently low units, outages, or gaps versus peers).
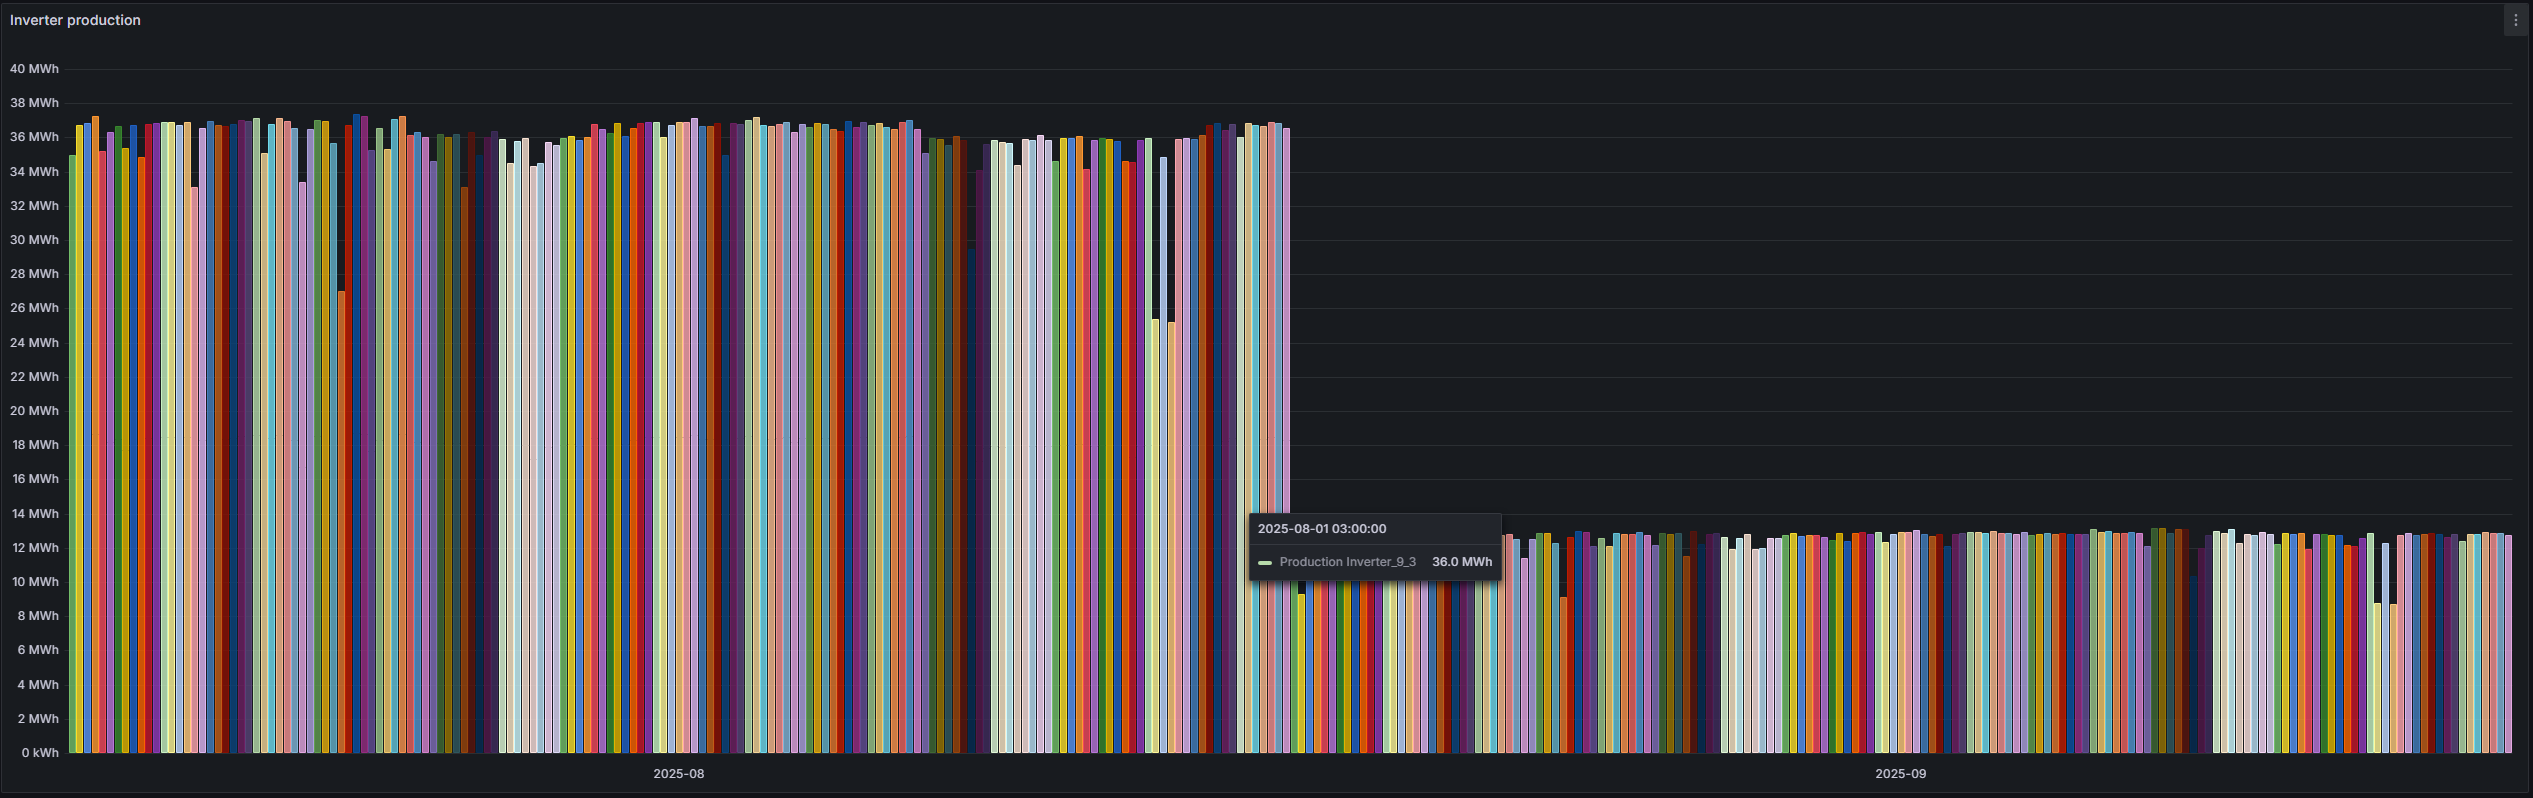
- Hover a bar to see the device name/ID, time bucket, and energy value.
- Zoom with click-drag; Ctrl/Cmd + Z to step out, or use the time-picker arrows.
Interpretation: Monthly view helps validate totals and find long-term gaps. Hourly/Daily views are better for detecting short outages, curtailment windows, or intermittent faults.